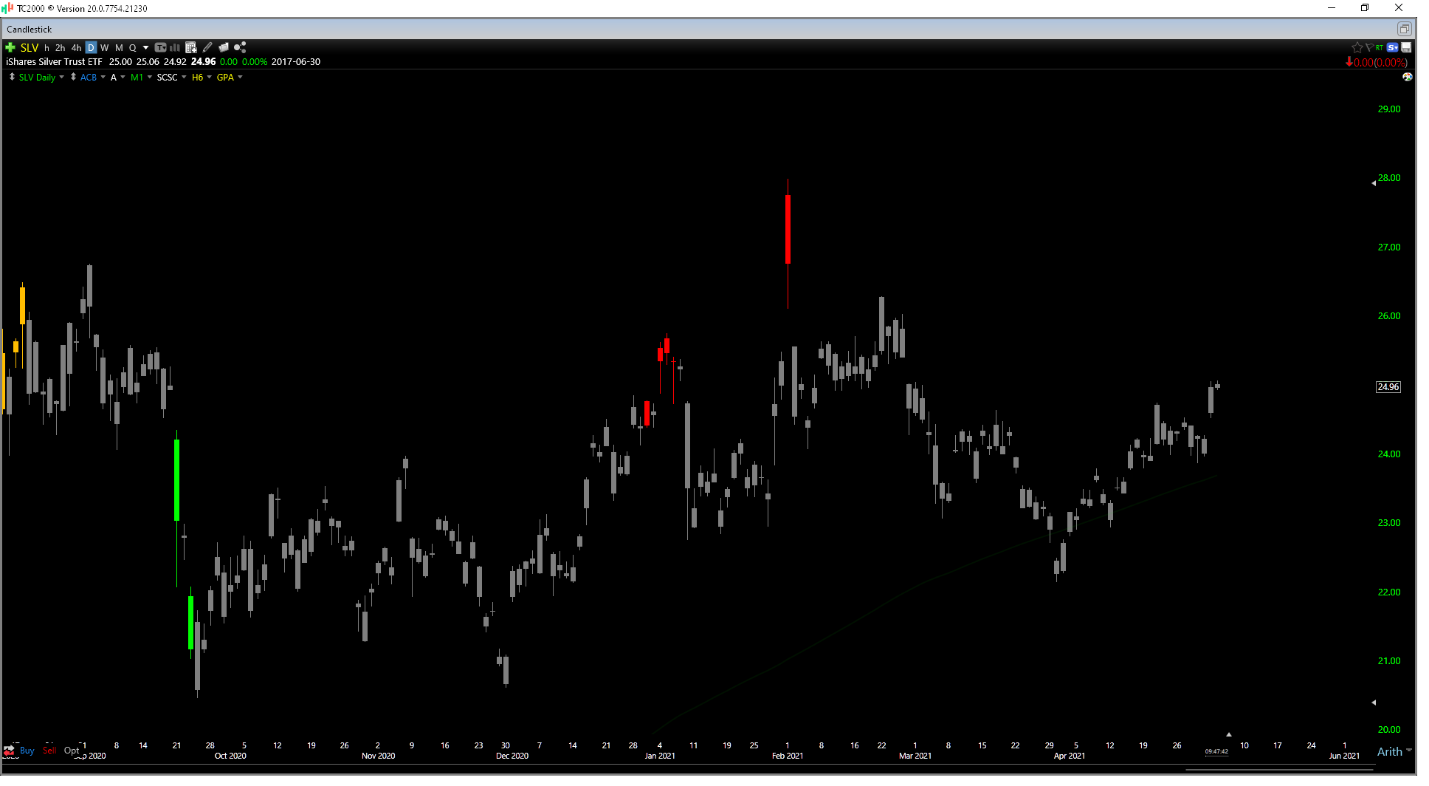
Thus far, it’s been a volatile Q2 for the precious metals. Silver (SLV) has traded in a 13% range since the start of April, with most of the volatility to the upside. This outperformance has helped silver to regain some ground vs. the S&P-500 (SPY), underperforming the index just over 900 basis points year-to-date but still lagging last year’s outperformance. Fortunately, the one area silver is leading is relative to gold (GLD), a great sign for the precious metals. Generally, the precious metals perform much better when silver is leading, and typically, pullbacks with a bullish silver/gold ratio are simply violent corrections and not the start of new bear markets. Let’s take a closer look below:
(Source: TC2000.com)
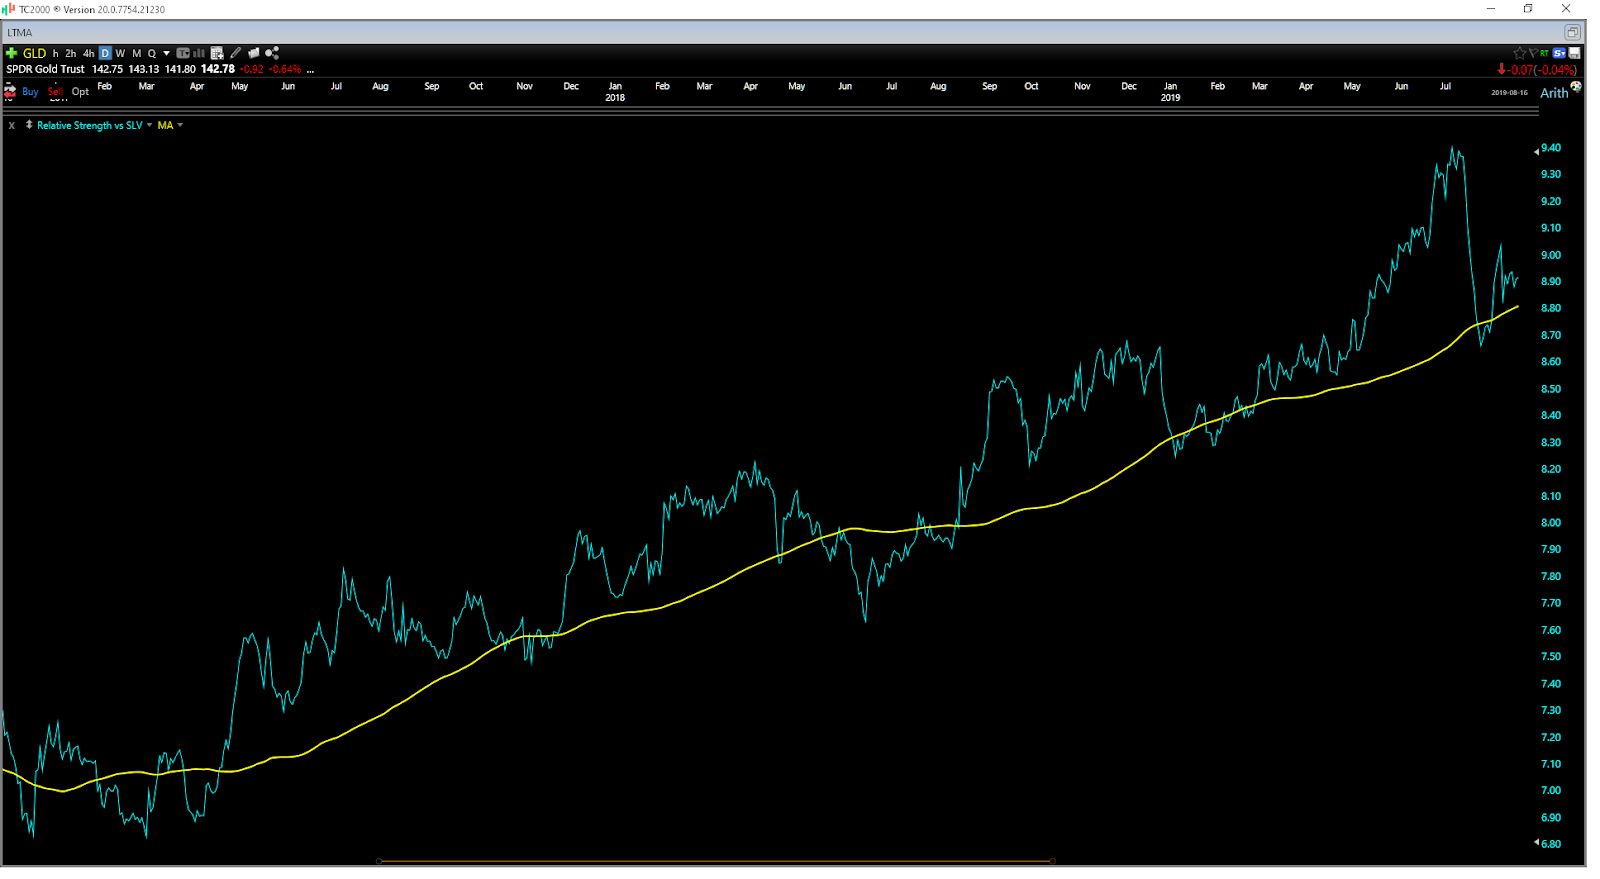
As shown in the chart below, the silver/gold ratio continues to remain in a strong uptrend since Q3 of last year and is now within a stone’s throw of a new 52-week high. This outperformance during the recent 8-month correction in miners and metals suggests that there’s no reason to give up on hopes of a new bull market in metals because silver continues to lead by a wide margin. At previous cyclical and secular tops, silver has typically broken down and starting making new lows vs. gold, and this is not what we’ve seen recently.
We saw this during April of 2011 as silver made a new 30-day low while gold was continuing its march to new highs. This was a canary in the coal mine for the eventual new highs gold would make three months later in August, suggesting the rally was not sustainable.

(Source: TC2000.com)
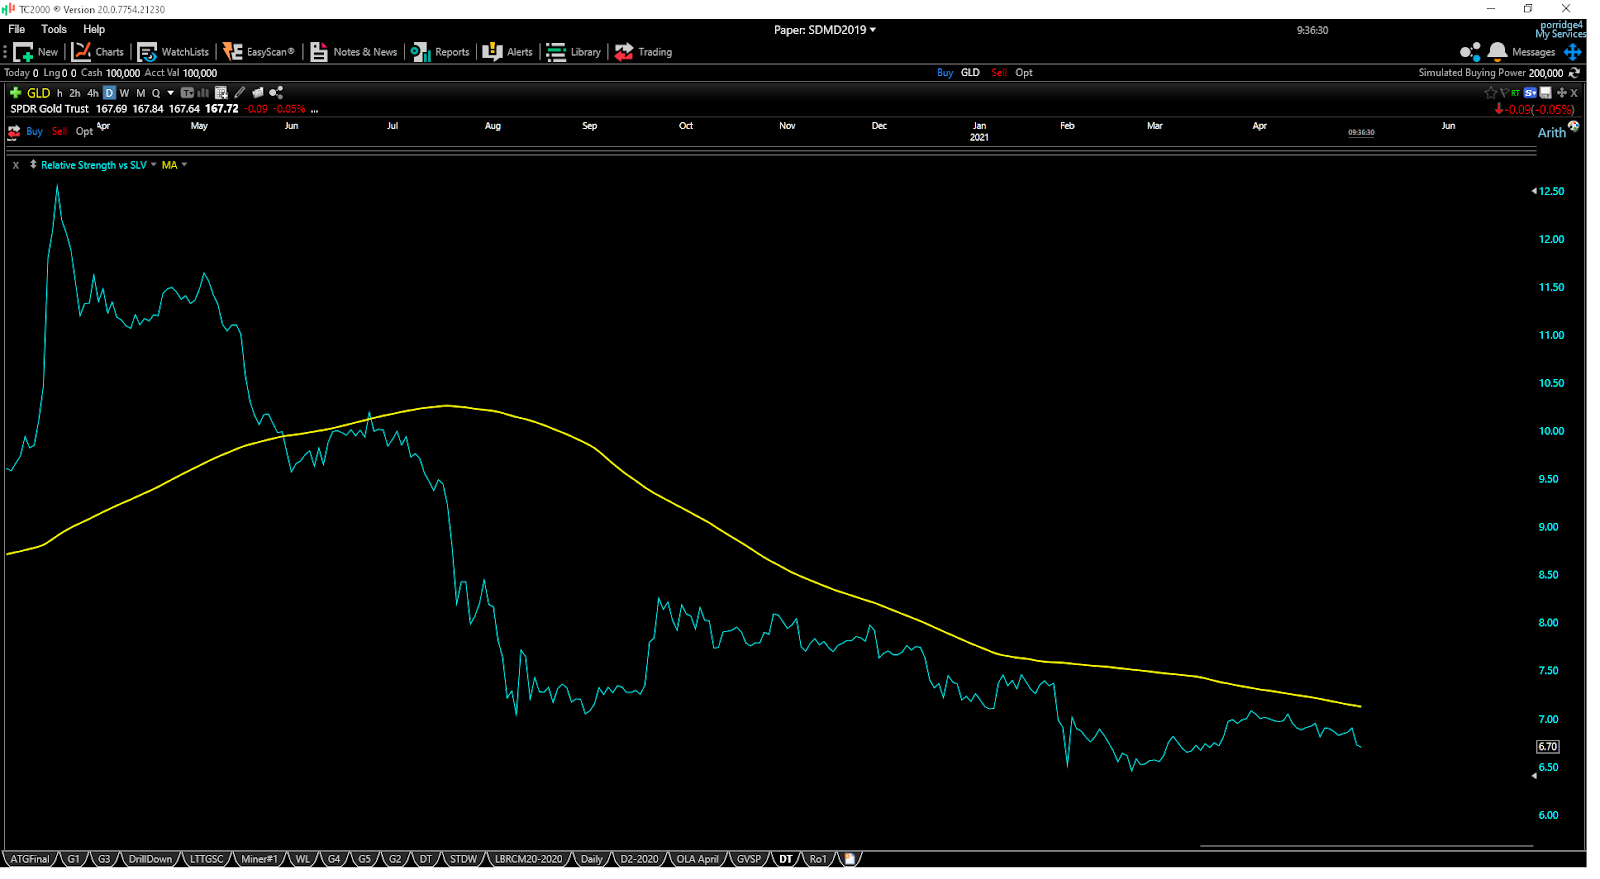
If we look at a chart of the gold vs. silver ratio, we can see that the long-term moving average (yellow line) was previously a major support level for this ratio. However, this has changed dramatically since silver began outperforming after the COVID-19 Crash.
Currently, this moving average now looks to be acting as resistance, and the brief outperformance of gold vs. silver looks to be allowing this moving average to play catch up, with the ratio now nearing resistance. If this is the case, we would expect this ratio to break down over the next two to three months and the silver/gold ratio to make new highs. Given that this ratio is sitting near resistance, any weakness in silver below $24.00/oz, which would push this ratio towards resistance, providing a buying opportunity.
(Source: TC2000.com)
(Source: TC2000.com)
While the precious metals trade has been quite frustrating the past several months, it’s important to note that the fundamentals for silver are better than ever. Not only do we have a trend towards electrification domestically and globally that should drive demand for silver, but we also have real interest rates that remain negative. Gold typically performs very well during these periods.
Finally, we have some countries where massive silver mines reside that are showing more hostility towards miners (Peru). This is based on Presidential candidate Castillo’s comments that at least 70% of mineral profits would stay in Peru if he is elected in June. With significant demand for silver from solar and minor supply headwinds, if miners decided to stop building mines in Peru or curtail production, the fundamentals remain strong for silver.
So, what’s the best course of action?
With a strong fundamental backdrop and the silver/gold ratio continuing to outperform, I see no reason to rush to take profits on silver. Currently, the monthly range for silver is $22.00/oz to $29.00/oz, and any rallies above $28.50 would be an opportunity to book some profits.
However, with a high likelihood that the metal finally breaks out of this range in 2021, I continue to remain bullish on the metal long-term. I would expect any 15% pullbacks to provide low-risk buying opportunities. This would line up with any dips below $24.00/oz or into the low end of the current trading range.
Disclosure: I am long GLD
SLV shares were trading at $24.59 per share on Tuesday afternoon, down $0.37 (-1.48%). Year-to-date, SLV has gained 0.08%, versus a 11.13% rise in the benchmark S&P 500 index during the same period.
About the Author: Taylor Dart

Taylor has over a decade of investing experience, with a special focus on the precious metals sector. In addition to working with ETFDailyNews, he is a prominent writer on Seeking Alpha. Learn more about Taylor’s background, along with links to his most recent articles.
The post Here's What This Important Indicator is Saying for Silver Prices appeared first on StockNews.com