
BrightView Holdings, Inc. (NYSE:BV) (the “Company” or “BrightView”), the leading commercial landscaping services company in the United States, today reported unaudited results for the second quarter ended March 31, 2020.
This press release features multimedia. View the full release here: https://www.businesswire.com/news/home/20200507005220/en/
(Graphic: Business Wire)
Second Quarter Fiscal 2020 Highlights
-
Maintenance revenue of $416.2 million; a 12.1% decline compared to prior year of $473.3 million;
-
Snow revenue of $102.5 million; a 46.5% decline compared to prior year of $191.5 million.
- Decline driven by meaningfully lower snowfall as compared to historical averages.
-
Land revenue of $313.7 million; 11.3% growth compared to prior year of $281.8 million.
- Maintenance land organic growth of 1.9%.
-
Snow revenue of $102.5 million; a 46.5% decline compared to prior year of $191.5 million.
- Development revenue of $143.6 million, a 15.8% increase compared to prior year of $124.0 million;
-
M&A strategy continues to be a reliable and sustainable source of revenue growth;
- Acquired three commercial landscaping companies in critical and growing markets;
- Net Loss of $20.5 million, or $(0.20) per share, and a net loss margin of 3.7%, compared to Net Loss of $3.6 million, or $(0.04) per share, and a net loss margin of 0.6%, in the prior year;
- Adjusted EBITDA of $38.9 million and Adjusted EBITDA margin of 7.0%, compared to Adjusted EBITDA of $61.1 million and Adjusted EBITDA margin of 10.2% in the prior year, with the negative variance largely driven by the decremental margins due to the 46.5% lower snow revenue which would normally better leverage our fixed cost base during the snow season;
- Cash flows from operating activities of $78.4 million, an increase of 34.5% compared to $58.3 million in the prior year;
- Free Cash Flow of $59.4 million, an increase of 73.7% compared to prior year of $34.2 million.
Six Months Fiscal 2020 Highlights
- Total Revenues for the six months were $1,129.8 million, a 0.6% increase compared to $1,122.7 million in the prior year;
-
Maintenance revenue of $835.1 million; a 3.5% decline compared to prior year of $865.8 million;
-
Snow revenue of $158.1 million; a 34.0% decline compared to prior year of $239.7 million.
- Decline driven by meaningfully lower snowfall as compared to historical averages.
-
Land revenue of $677.0 million; 8.1% growth compared to prior year of $626.1 million.
- Maintenance land organic growth of 0.7% excluding the impact in the first fiscal quarter from the wind down of our strategic managed exit initiative.
-
Snow revenue of $158.1 million; a 34.0% decline compared to prior year of $239.7 million.
- Development revenue of $296.4 million, a 14.7% increase compared to prior year of $258.4 million;
- Net Loss of $33.1 million, or ($0.32) per share, and a net loss margin of 2.9%, compared to Net Loss of $12.4 million, or ($0.12) per share, and a net loss margin of 1.1%, in the prior year;
- Adjusted EBITDA of $90.5 million and Adjusted EBITDA margin of 8.0%, compared to Adjusted EBITDA of $111.2 million and Adjusted EBITDA margin of 9.9% in the prior year, with the negative variance largely driven by the decremental margins due to the lower snow revenue;
- Cash flows from operating activities of $85.7 million, an increase of 32.5% compared to $64.7 million in the prior year;
- Free Cash Flow of $53.3 million, an increase of 112.4% compared to prior year of $25.1 million.
“We are very pleased with our Landscape maintenance organic revenue growth of 1.9% in the quarter, which was the strongest since our 2018 IPO. Free Cash Flow remains robust and our Development Segment delivered its third straight quarter of double-digit revenue growth,” said Andrew Masterman, BrightView President and Chief Executive Officer. “Historically low snowfall in many of our key regions had an adverse impact on both revenue and Adjusted EBITDA, but we are encouraged by the growth trend on snow contracts. Further, our acquisition strategy continued to be a reliable and sustainable source of revenue growth. As an essential service as defined by the Department of Homeland Security, all branches are operational at this time, with only isolated limitations as to the scope of services we can provide, specifically in the city of Boston, New York City and the San Francisco Bay Area. Keeping our employees, their families and our customers safe is our number one priority. BrightView is well positioned to overcome potential headwinds due to the COVID-19 outbreak and emerge from this crisis a stronger company.”
Fiscal 2020 Results – Total BrightView
Total BrightView - Operating Highlights | |||||||||||||||||||||
Three Months Ended
| Six Months Ended
| ||||||||||||||||||||
($ in millions, except per share figures) | 2020 | 2019 | Change | 2020 | 2019 | Change | |||||||||||||||
Revenue | $ | 559.1 | $ | 596.6 | (6.3%) | $ | 1,129.8 | $ | 1,122.7 | 0.6% | |||||||||||
Net Loss | $ | (20.5 | ) | $ | (3.6 | ) | 469.4% | $ | (33.1 | ) | $ | (12.4 | ) | 166.9% | |||||||
Net Loss Margin | (3.7 | %) | (0.6 | %) | 516.7% | (2.9 | %) | (1.1 | %) | 163.6% | |||||||||||
Adjusted EBITDA | $ | 38.9 | $ | 61.1 | (36.3%) | $ | 90.5 | $ | 111.2 | (18.6%) | |||||||||||
Adjusted EBITDA Margin | 7.0 | % | 10.2 | % | (320) bps | 8.0 | % | 9.9 | % | (190) bps | |||||||||||
Adjusted Net Income | $ | 1.9 | $ | 15.6 | (87.8%) | $ | 12.5 | $ | 26.0 | (51.9%) | |||||||||||
Earnings per Share, GAAP | $ | (0.20 | ) | $ | (0.04 | ) | (400.0%) | $ | (0.32 | ) | $ | (0.12 | ) | (166.7%) | |||||||
Earnings per Share, Adjusted | $ | 0.02 | $ | 0.15 | (86.7%) | $ | 0.12 | $ | 0.25 | (52.0%) | |||||||||||
Weighted average number of common shares outstanding | 103.7 | 102.8 | 0.9% | 103.5 | 102.6 | 0.9% | |||||||||||||||
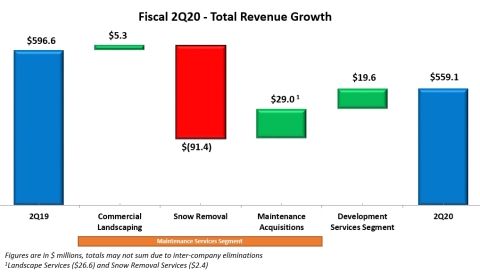
For the second quarter of fiscal 2020, total revenue decreased 6.3% to $559.1 million due to decreases in the Maintenance Services Segment driven by meaningfully lower snowfall as compared to historical averages, partially offset by increases in Development Services Segment revenues. Net Loss was $20.5 million compared to $3.6 million in the 2019 period, attributable to lower Income from operations and a decrease in Other income, partially offset by a decrease in Interest expense and an increase in the Income tax benefit. Total Adjusted EBITDA decreased 36.3% due to a decrease in Maintenance Services Segment Adjusted EBITDA driven by the decremental margins as a result of the lower snow revenue, partially offset by an increase in Development Services Segment Adjusted EBITDA, as discussed further below.
For the six months ended March 31, 2020, total revenue increased 0.6% to $1,129.8 million due to increases in Development Services Segment, partially offset by a decrease in Maintenance Services Segment revenues driven by meaningfully lower snowfall as compared to historical averages. Total Adjusted EBITDA was $90.5 million, down 18.6% versus the prior year, due to a decrease in Maintenance Services Segment Adjusted EBITDA driven by the decremental margins as a result of the lower snow revenue, partially offset by an increase in Development Services Segment Adjusted EBITDA, as discussed further below.
Fiscal 2020 Results – Segments
Maintenance Services - Operating Highlights | |||||||||||||||||||||
Three Months Ended
| Six Months Ended
| ||||||||||||||||||||
($ in millions) | 2020 | 2019 | Change | 2020 | 2019 | Change | |||||||||||||||
Landscape Maintenance | $ | 313.7 | $ | 281.8 | 11.3% | $ | 677.0 | $ | 626.1 | 8.1% | |||||||||||
Snow Removal | $ | 102.5 | $ | 191.5 | (46.5%) | $ | 158.1 | $ | 239.7 | (34.0%) | |||||||||||
Total Revenue | $ | 416.2 | $ | 473.3 | (12.1%) | $ | 835.1 | $ | 865.8 | (3.5%) | |||||||||||
Adjusted EBITDA | $ | 41.2 | $ | 65.0 | (36.6%) | $ | 88.9 | $ | 113.7 | (21.8%) | |||||||||||
Adjusted EBITDA Margin | 9.9 | % | 13.7 | % | (380) bps | 10.6 | % | 13.1 | % | (250) bps | |||||||||||
Capital Expenditures | $ | 14.3 | $ | 18.9 | (24.3%) | $ | 26.1 | $ | 30.0 | (13.0%) | |||||||||||
For the second quarter fiscal 2020, revenue in the Maintenance Services Segment decreased 12.1% to $416.2 million. Revenues from snow removal services were $102.5 million, a decrease of $89.0 million over the 2019 period and revenue from landscape maintenance services were $313.7 million, an increase of $31.9 million over the 2019 period. The decrease in snow removal services was primarily attributable to a decreased frequency of snowfall events, the lower volume of snowfall per event and the lower relative snowfall in the three months ended March 31, 2020 as compared to the 2019 period (for our current branch structure, snowfall for the three months ended March 31, 2020 and 2019 was 43.3% and 86.2%, respectively, of the historical 10-year average for that three-month period). The increase in landscape maintenance services was driven by a $26.6 million revenue contribution from acquired businesses as well as $5.3 million or 1.9% growth in underlying commercial landscaping.
Adjusted EBITDA for the Maintenance Services Segment in the quarter decreased 36.6% to $41.2 million, with the Adjusted EBITDA Margin decreasing 380 basis points versus the prior year. The decrease in Adjusted EBITDA Margin was principally due to the decrease in snow removal revenues described above as well as an increase in selling, general, and administrative expenses to drive new business growth and increase customer retention.
For the six months ended March 31, 2020, revenue in the Maintenance Services Segment decreased 3.5% to $835.1 million. Revenues from snow removal services were $158.1 million, a decrease of $81.6 million over the 2019 period and revenues from landscape maintenance services were $677.0 million, an increase of $50.9 million over the 2019 period. The decrease in snow removal services is primarily attributable to a decreased frequency of snowfall events, the lower volume of snowfall per event and the lower relative snowfall in the six months ended March 31, 2020 (for our current branch structure, snowfall for the six months ended March 31, 2020 and 2019 was 57.9% and 85.6%, respectively, of the historical 10-year average for that six-month period). The increase in landscape services revenues was driven by a $48.2 million revenue contribution from acquired businesses as well as $4.4 million or 0.7% growth in underlying commercial landscaping excluding the impact in the first fiscal quarter from the wind down of our strategic managed exit initiative.
Adjusted EBITDA for the Maintenance Services Segment for the six months ended March 31, 2020 decreased 21.8% to $88.9 million, with the Adjusted EBITDA margin decreasing 250 basis points versus the prior year. The decrease in Segment Adjusted EBITDA was due to the decrease in snow removal revenues described above as well as an increase in selling, general, and administrative expenses to drive new business growth and increase customer retention.
Development Services - Operating Highlights | |||||||||||||||||||||
Three Months Ended
| Six Months Ended
| ||||||||||||||||||||
($ in millions) | 2020 | 2019 | Change | 2020 | 2019 | Change | |||||||||||||||
Revenue | $ | 143.6 | $ | 124.0 | 15.8% | $ | 296.4 | $ | 258.4 | 14.7% | |||||||||||
Adjusted EBITDA | $ | 13.7 | $ | 11.0 | 24.5% | $ | 32.8 | $ | 28.1 | 16.7% | |||||||||||
Adjusted EBITDA Margin | 9.5 | % | 8.9 | % | 60 bps | 11.1 | % | 10.9 | % | 20 bps | |||||||||||
Capital Expenditures | $ | 5.9 | $ | 3.5 | 68.6% | $ | 7.9 | $ | 6.7 | 17.9% | |||||||||||
For the second quarter fiscal 2020, revenue in the Development Services Segment increased 15.8% to $143.6 million. The increase in Development Services revenues was driven by higher project volumes and an increase in the project completion percentage compared to the 2019 period.
Adjusted EBITDA for the Development Services Segment increased 24.5% to $13.7 million in the quarter. The increase in Segment Adjusted EBITDA was due to the increase in net service revenues described above combined with productivity improvements across the segment. Segment Adjusted EBITDA Margin increased 60 basis points, to 9.5%, in the three months ended March 31, 2020, from 8.9% in the 2019 period.
Revenues for the Development Services Segment increased 14.7% to $296.4 million for the six months ended March 31, 2020. The increase in Development Services revenues was driven by higher project volumes and an increase in the project completion percentage compared to the prior fiscal period.
Adjusted EBITDA for the Development Services Segment increased 16.7% to $32.8 million during the six months ended March 31, 2020. The increase in Segment Adjusted EBITDA was due to the increase in net service revenues described above as well as increased productivity across the segment. Segment Adjusted EBITDA Margin increased 20 basis points, to 11.1%, in the six months ended March 31, 2020, from 10.9% in the 2019 period.
Total BrightView Cash Flow Metrics | |||||||||||
Six Months Ended
| |||||||||||
($ in millions) | 2020 | 2019 | Change | ||||||||
Cash Provided by Operating Activities | $ | 85.7 | $ | 64.7 | 32.5% | ||||||
Free Cash Flow | $ | 53.3 | $ | 25.1 | 112.4% | ||||||
Capital Expenditures | $ | 35.1 | $ | 42.6 | (17.6%) | ||||||
Net cash provided by operating activities for the six months ended March 31, 2020 was $85.7 million, compared to $64.7 million for the prior year. This increase was primarily due to an increase in cash provided by accounts receivable and an increase in cash provided by unbilled and deferred revenue offset by a decrease in cash provided by other operating assets and a decrease in cash provided by accounts payable and other operating liabilities.
Free Cash Flow for the six months ended March 31, 2020 was $53.3 million, an increase of $28.2 million versus the prior year. The increase in Free Cash Flow was principally due to the increase in cash flows from operating activities of $21.0 million described above, as well as a decrease in capital expenditures of $7.5 million as further described below.
For the six months ended March 31, 2020, capital expenditures were $35.1 million, compared with $42.6 million in the prior year. The Company also generated proceeds from the sale of property and equipment of $2.7 million and $3.0 million in the first half of fiscal 2020 and 2019, respectively. Net of the proceeds from the sale of property and equipment in the six months, net capital expenditures represented 3.3% and 4.1% of revenue in the first half of fiscal 2020 and 2019, respectively.
Total BrightView Balance Sheet Metrics | ||||||||
($ in millions) | March 31,
| March 31,
| September 30,
| |||||
Total Financial Debt1 | $ | 1,254.4 | $ | 1,185.3 | $ | 1,170.2 | ||
Total Cash & Equivalents | $ | 88.0 | $ | 11.2 | $ | 39.1 | ||
Total Net Financial Debt2 to Adjusted EBITDA ratio | 4.1x | 4.0x | 3.7x | |||||
1Total Financial Debt includes total long-term debt, net of original issue discount, and finance/capital lease obligations | ||||||||
2Total Net Financial Debt equals Total Financial Debt minus Total Cash & Equivalents | ||||||||
As of March 31, 2020, the Company’s Total Net Financial Debt was $1,166.4 million, a decrease of $7.7 million compared to $1,174.1 million as of March 31, 2019. The Company’s Total Net Financial Debt to Adjusted EBITDA ratio was 4.1x as of March 31, 2020, compared with 4.0x as of March 31, 2019.
Second Quarter Acquisitions
During the second quarter, BrightView acquired Signature Coast Holdings, LLC, Summit Landscape Group, LLC and 4 Seasons Landscape Group, LLC. These acquisitions are consistent with BrightView’s long-term M&A strategy and further strengthens its presence in critical and growing markets:
- Signature Coast’s operations span nine strategic locations in both California (Concord, Davis, Marin, Napa, Rocklin, Sacramento and Santa Rosa) and Nevada (Carson City and Reno). Signature provides landscape maintenance, irrigation, enhancement, and arbor care.
- Established in 2011, Summit serves the Charlotte, Charleston and Hilton Head markets in the Carolinas, as well as clients in Nashville, Tennessee. The Summit team offers a full suite of landscaping services including turf management, agronomics, tree and plant care, landscape design and installation, storm water control and inspection, and soil stabilization.
- 4 Seasons provides services across the Atlanta metropolitan market in landscape maintenance, hardscapes, irrigation, enhancement, arbor care and other facility support services to the commercial, multi-family, hospitality, municipal and HOA market segments.
COVID-19 Update
- Throughout virtually the entire country, landscape maintenance is recognized as an essential service as defined by the Department of Homeland Security.
- All branches operational; isolated limitations on the scope of services we can provide.
- Executing downturn playbook and implementing prudent actions to preserve cash.
- Temporarily deferring discretionary merit increases for all employees and implemented a hiring freeze.
- Limiting all discretionary spending and capital expenditures.
-
Specific Health and Safety actions include:
- Proactively communicating critical information from CDC to all employees.
- Implemented branch based social distancing and hygiene and sanitization procedures.
- Continuing to prohibit non-essential travel and mandated work from home policies as applicable.
- Adhering to all state and local mandates and guidelines.
- Tracking potential cases and exposure, assigning case workers, and launched paid sick leave.
Conference Call Information
A conference call to discuss the second quarter fiscal 2020 financial results is scheduled for May 7, 2020, at 10 a.m. EDT. The dial-in for the conference call is (833) 968-2326 and the international dial-in is (778) 560-2844. The conference ID is 7999761. A live audio webcast of the conference call will be available on the Company’s investor website https://investor.brightview.com, where the presentation materials will be posted prior to the call.
A replay of the call will be available from 1 p.m. EDT on May 7, 2020 to 11:59 p.m. EDT on May 14, 2020. To access the recording, dial (800) 585-8367 or (416) 621-4642. The conference ID is 7999761.
About BrightView
BrightView is the largest provider of commercial landscaping services in the United States. Through its team of approximately 21,000 employees, BrightView provides services ranging from landscape maintenance and enhancements to tree care and landscape development for thousands of customers’ properties, including corporate and commercial properties, HOAs, public parks, hotels and resorts, hospitals and other healthcare facilities, educational institutions, restaurants and retail, and golf courses, among others. BrightView is the Official Field Consultant to Major League Baseball.
Forward Looking Statements
This press release contains forward looking statements that involve substantial risks and uncertainties. All statements, other than statements of historical facts, contained in this presentation, including statements regarding our industry, strategy, future operations, future liquidity and financial position, future revenues, projected costs, prospects, plans and objectives of management, are forward-looking statements. The words “believes,” “expects,” “may,” “will,” “should,” “seeks,” “intends,” “plans,” “estimates,” or “anticipates,” or similar expressions are intended to identify forward-looking statements, although not all forward-looking statements contain these identifying words. By their nature, forward-looking statements: speak only as of the date they are made; are not statements of historical fact or guarantees of future performance; and are subject to risks, uncertainties, assumptions, or changes in circumstances that are difficult to predict or quantify. Our expectations, beliefs, and projections are expressed in good faith and we believe there is a reasonable basis for them. However, there can be no assurance that management’s expectations, beliefs and projections will result or be achieved and actual results may vary materially from what is expressed in or indicated by the forward-looking statements. The forward-looking statements contained in this presentation reflect our current views with respect to future events, and we assume no obligation to update any forward-looking statements. Factors that could cause actual results to differ materially from those projected include, but are not limited to: the duration and extent of the novel coronavirus (COVID-19) pandemic and the impact of federal, state, and local governmental actions and customer behavior in response to the pandemic and such governmental actions; the risk that our Maintenance and Development operations may be deemed not to be an essential business or service in jurisdictions where we operate; customer cancellations or delays of work; any adverse impact on the timing and collectability of payments to us from customers as a result of the impact of COVID-19 on them; operational disruptions if a significant percentage of our workforce is unable to work or we experience labor shortages, including because of illness or travel or government restrictions in connection with the COVID-19 pandemic and delays in H2-B visa processing; general business, economic and financial conditions; competitive industry pressures; the failure to retain certain current customers, renew existing customer contracts and obtain new customer contracts; a determination by customers to reduce their outsourcing or use of preferred vendors; the dispersed nature of our operating structure; our ability to implement our business strategies and achieve our growth objectives; acquisition and integration risks; the seasonal nature of our landscape maintenance services; our dependence on weather conditions; increases in prices for raw materials and fuel; product shortages and the loss of key suppliers; our ability to accurately estimate costs of a contract; the conditions and periodic fluctuations of real estate markets, including residential and commercial construction; our ability to retain our executive management and other key personnel; our ability to attract and retain trained workers and third-party contractors and re-employ seasonal workers; any failure to properly verify employment eligibility of our employees; subcontractors taking actions that harm our business; our recognition of future impairment charges; laws and governmental regulations, including those relating to employees, wage and hour, immigration, human health and safety and transportation; environmental, health and safety laws and regulations, including regulatory costs, claims and litigation related to the use of chemicals and pesticides by employees and related third-party claims; the distraction and impact caused by litigation, of adverse litigation judgments or settlements resulting from legal proceedings; increase in on-job accidents involving employees; any failure, inadequacy, interruption, security failure or breach of our information technology systems; any failure to protect the security of personal information about our customers, employees and third parties; our ability to adequately protect our intellectual property; occurrence of natural disasters, terrorist attacks or other external events; our ability to generate sufficient cash flow to satisfy our significant debt service obligations; our ability to obtain additional financing to fund future working capital, capital expenditures, investments or acquisitions, or other general corporate requirements; restrictions imposed by our debt agreements that limit our flexibility in operating our business; increases in interest rates governing our variable rate indebtedness increasing the cost of servicing our substantial indebtedness including proposed changes to or elimination of LIBOR; and counterparty credit worthiness risk or risk of non-performance with respect to derivative financial instruments. Additional factors that could cause our results to differ materially from those described in the forward-looking statements can be found under “Item 1A. Risk Factors” in our Form 10-K for the fiscal year ended September 30, 2019 as such factors may be updated from time to time in our periodic filings with the SEC, which are accessible on the SEC’s website at www.sec.gov.
Non-GAAP Financial Measures
To supplement the Company’s financial information presented in accordance with GAAP and aid understanding of the Company’s business performance, the Company uses certain non-GAAP financial measures, namely “Adjusted EBITDA”, “Adjusted EBITDA Margin”, “Adjusted Net Income” “Adjusted Earnings per Share”, “Free Cash Flow”, Total Financial Debt” and “Total Net Financial Debt”. We believe Adjusted EBITDA, Adjusted EBITDA Margin, Adjusted Net Income, Adjusted Earnings per Share, Free Cash Flow, Total Financial Debt and Total Net Financial Debt assist investors and in comparing our results across reporting periods on a consistent basis by excluding items that we do not believe are indicative of our core operating performance. Management believes these non-GAAP financial measures are useful to investors in highlighting trends in our operating performance, while other measures can differ significantly depending on long-term strategic decisions regarding capital structure, the tax jurisdictions in which we operate and capital investments. Management regularly uses these measures as tools in evaluating our operating performance, financial performance and liquidity. Management uses Adjusted EBITDA, Adjusted EBITDA Margin, Adjusted Net Income, Adjusted Earnings per Share, Free Cash Flow, Total Financial Debt and Total Net Financial Debt to supplement comparable GAAP measures in the evaluation of the effectiveness of our business strategies, to make budgeting decisions, to establish discretionary annual incentive compensation and to compare our performance against that of other peer companies using similar measures. In addition, we believe that Adjusted EBITDA, Adjusted EBITDA Margin, Adjusted Net Income, Adjusted Net Income per Share, Free Cash Flow, Total Financial Debt and Total Net Financial Debt are frequently used by investors and other interested parties in the evaluation of issuers, many of which also present Adjusted EBITDA, Adjusted EBITDA Margin, Adjusted Net Income, Adjusted Earnings per Share, Free Cash Flow, Total Financial Debt and Total Net Financial Debt when reporting their results in an effort to facilitate an understanding of their operating and financial results and liquidity. Management supplements GAAP results with non-GAAP financial measures to provide a more complete understanding of the factors and trends affecting the business than GAAP results alone.
Adjusted EBITDA: We define Adjusted EBITDA as net income (loss) before interest, taxes, depreciation and amortization, as further adjusted to exclude certain non-cash, non-recurring and other adjustment items.
Adjusted EBITDA Margin: We define Adjusted EBITDA Margin as Adjusted EBITDA, defined above, divided by Net Service Revenues.
Adjusted Net Income: We define Adjusted Net Income as net income (loss) including interest and depreciation, and excluding other items used to calculate Adjusted EBITDA and further adjusted for the tax effect of these exclusions and the removal of the discrete tax items.
Adjusted Earnings per Share: We define Adjusted Earnings per Share as Adjusted Net Income divided by the weighted average number of common shares outstanding for the period.
Free Cash Flow: We define Free Cash Flow as cash flows from operating activities less capital expenditures, net of proceeds from the sale of property and equipment.
Total Financial Debt: We define Total Financial Debt as total long-term debt, net of original issue discount, and finance/capital lease obligations.
Total Net Financial Debt: We define Total Net Financial Debt as Total Financial Debt minus total cash and cash equivalents.
Adjusted EBITDA, Adjusted EBITDA Margin, Adjusted Net Income, Adjusted Earnings per Share, Free Cash Flow, Total Financial Debt, and Total Net Financial Debt are not recognized terms under GAAP and should not be considered as an alternative to net income (loss) or the ratio of net income (loss) to net revenue as a measure of financial performance, cash flows provided by operating activities as a measure of liquidity, or any other performance measure derived in accordance with GAAP. Additionally, these measures are not intended to be a measure of free cash flow available for management’s discretionary use as they do not consider certain cash requirements such as interest payments, tax payments and debt service requirements. The presentations of these measures have limitations as analytical tools and should not be considered in isolation, or as a substitute for analysis of our results as reported under GAAP. Because not all companies use identical calculations, the presentations of these measures may not be comparable to other similarly titled measures of other companies and can differ significantly from company to company.
BrightView Holdings, Inc. | ||||||||
Consolidated Balance Sheets | ||||||||
(Unaudited) | ||||||||
(in millions)* | March 31,
| September 30,
| ||||||
Assets | ||||||||
Current assets: | ||||||||
Cash and cash equivalents | $ | 88.0 | $ | 39.1 | ||||
Accounts receivable, net | 334.0 | 333.7 | ||||||
Unbilled revenue | 81.3 | 107.6 | ||||||
Inventories | 30.0 | 26.5 | ||||||
Other current assets | 59.7 | 44.5 | ||||||
Total current assets | 593.0 | 551.4 | ||||||
Property and equipment, net | 278.3 | 272.4 | ||||||
Intangible assets, net | 241.7 | 251.5 | ||||||
Goodwill | 1,878.9 | 1,810.4 | ||||||
Operating lease assets | 66.7 | — | ||||||
Other assets | 45.3 | 42.9 | ||||||
Total assets | 3,103.9 | 2,928.6 | ||||||
Liabilities and Stockholders’ Equity | ||||||||
Current liabilities: | ||||||||
Accounts payable | $ | 112.3 | $ | 99.8 | ||||
Current portion of long-term debt | 10.4 | 10.4 | ||||||
Deferred revenue | 86.1 | 49.1 | ||||||
Current portion of self-insurance reserves | 45.6 | 37.4 | ||||||
Accrued expenses and other current liabilities | 137.3 | 136.0 | ||||||
Current portion of operating lease liabilities | 21.4 | — | ||||||
Total current liabilities | 413.1 | 332.7 | ||||||
Long-term debt, net | 1,220.8 | 1,134.2 | ||||||
Deferred tax liabilities | 50.9 | 64.4 | ||||||
Self-insurance reserves | 87.8 | 87.1 | ||||||
Long-term operating lease liabilities | 50.6 | — | ||||||
Other liabilities | 20.1 | 26.4 | ||||||
Total liabilities | 1,843.3 | 1,644.8 | ||||||
Stockholders’ equity: | ||||||||
Preferred stock, $0.01 par value; 50,000,000 shares authorized; no shares issued or outstanding as of March 31, 2020 and September 30, 2019 | — | — | ||||||
Common stock, $0.01 par value; 500,000,000 shares authorized; 104,900,000 and 104,700,000 shares issued and outstanding as of March 31, 2020 and September 30, 2019, respectively | 1.0 | 1.0 | ||||||
Treasury stock, at cost; 91,000 and 52,000 shares as of March 31, 2020 and September 30, 2019, respectively | (1.7 | ) | (1.0 | ) | ||||
Additional paid-in-capital | 1,457.3 | 1,441.8 | ||||||
Accumulated deficit | (179.4 | ) | (146.3 | ) | ||||
Accumulated other comprehensive loss | (16.6 | ) | (11.7 | ) | ||||
Total stockholders’ equity | 1,260.6 | 1,283.8 | ||||||
Total liabilities and stockholders’ equity | $ | 3,103.9 | $ | 2,928.6 | ||||
(*) Amounts may not total due to rounding. | ||||||||
BrightView Holdings, Inc. | ||||||||||||||||
Consolidated Statements of Operations | ||||||||||||||||
(Unaudited) | ||||||||||||||||
Three Months Ended
| Six Months Ended
| |||||||||||||||
2020 | 2019 | 2020 | 2019 | |||||||||||||
(in millions)* | ||||||||||||||||
Net service revenues | $ | 559.1 | $ | 596.6 | $ | 1,129.8 | $ | 1,122.7 | ||||||||
Cost of services provided | 426.8 | 450.5 | 854.5 | 844.7 | ||||||||||||
Gross profit | 132.3 | 146.1 | 275.3 | 278.0 | ||||||||||||
Selling, general and administrative expense | 126.9 | 119.5 | 257.1 | 229.6 | ||||||||||||
Amortization expense | 13.6 | 13.8 | 27.1 | 28.9 | ||||||||||||
(Loss) income from operations | (8.2 | ) | 12.8 | (8.9 | ) | 19.5 | ||||||||||
Other income (expense) | (1.9 | ) | 1.2 | (1.3 | ) | (0.3 | ) | |||||||||
Interest expense | 17.1 | 18.9 | 34.5 | 36.1 | ||||||||||||
(Loss) before income taxes | (27.2 | ) | (4.9 | ) | (44.7 | ) | (16.9 | ) | ||||||||
Income tax benefit | 6.7 | 1.3 | 11.6 | 4.5 | ||||||||||||
Net (loss) | $ | (20.5 | ) | $ | (3.6 | ) | $ | (33.1 | ) | $ | (12.4 | ) | ||||
(Loss) per share: | ||||||||||||||||
Basic and diluted | $ | (0.20 | ) | $ | (0.04 | ) | $ | (0.32 | ) | $ | (0.12 | ) | ||||
BrightView Holdings, Inc. | ||||||||||||||||
Segment Reporting | ||||||||||||||||
(Unaudited) | ||||||||||||||||
Three Months Ended
| Six Months Ended
| |||||||||||||||
2020 | 2019 | 2020 | 2019 | |||||||||||||
(in millions)* | ||||||||||||||||
Maintenance Services | $ | 416.2 | $ | 473.3 | $ | 835.1 | $ | 865.8 | ||||||||
Development Services | 143.6 | 124.0 | 296.4 | 258.4 | ||||||||||||
Eliminations | (0.7 | ) | (0.7 | ) | (1.7 | ) | (1.5 | ) | ||||||||
Net Service Revenues | $ | 559.1 | $ | 596.6 | $ | 1,129.8 | $ | 1,122.7 | ||||||||
Maintenance Services | $ | 41.2 | $ | 65.0 | $ | 88.9 | $ | 113.7 | ||||||||
Development Services | 13.7 | 11.0 | 32.8 | 28.1 | ||||||||||||
Corporate | (16.0 | ) | (14.9 | ) | (31.2 | ) | (30.6 | ) | ||||||||
Adjusted EBITDA | $ | 38.9 | $ | 61.1 | $ | 90.5 | $ | 111.2 | ||||||||
Maintenance Services | $ | 14.3 | $ | 18.9 | $ | 26.1 | $ | 30.0 | ||||||||
Development Services | 5.9 | 3.5 | 7.9 | 6.7 | ||||||||||||
Corporate | 0.4 | 2.9 | 1.1 | 5.9 | ||||||||||||
Capital Expenditures | $ | 20.6 | $ | 25.3 | $ | 35.1 | $ | 42.6 | ||||||||
(*) Amounts may not total due to rounding. | ||||||||||||||||
BrightView Holdings, Inc. | ||||||||
Consolidated Statements of Cash Flows | ||||||||
(Unaudited) | ||||||||
Six Months Ended
| ||||||||
2020 | 2019 | |||||||
(in millions)* | ||||||||
Cash flows from operating activities: | ||||||||
Net (loss) | $ | (33.1 | ) | $ | (12.4 | ) | ||
Adjustments to reconcile net (loss) to net cash provided by operating activities: | ||||||||
Depreciation | 39.5 | 41.0 | ||||||
Amortization of intangible assets | 27.1 | 28.9 | ||||||
Amortization of financing costs and original issue discount | 1.8 | 1.9 | ||||||
Deferred taxes | (11.6 | ) | (7.6 | ) | ||||
Equity-based compensation | 13.1 | 11.5 | ||||||
Other non-cash activities, net | 6.3 | 0.8 | ||||||
Change in operating assets and liabilities: | ||||||||
Accounts receivable | 8.1 | (33.5 | ) | |||||
Unbilled and deferred revenue | 63.9 | 31.9 | ||||||
Inventories | (2.9 | ) | (0.8 | ) | ||||
Other operating assets | (15.4 | ) | 3.8 | |||||
Accounts payable and other operating liabilities | (11.1 | ) | (0.8 | ) | ||||
Net cash provided by operating activities | 85.7 | 64.7 | ||||||
Cash flows from investing activities: | ||||||||
Purchase of property and equipment | (35.1 | ) | (42.6 | ) | ||||
Proceeds from sale of property and equipment | 2.7 | 3.0 | ||||||
Business acquisitions, net of cash acquired | (87.1 | ) | (49.3 | ) | ||||
Other investing activities, net | 0.6 | 1.2 | ||||||
Net cash used in investing activities | (118.9 | ) | (87.7 | ) | ||||
Cash flows from financing activities: | ||||||||
Repayments of finance lease obligations | (3.2 | ) | (2.8 | ) | ||||
Repayments of term loan | (5.2 | ) | (7.8 | ) | ||||
Repayments of receivables financing agreement | (50.0 | ) | (75.0 | ) | ||||
Repayments of revolving credit facility | (10.0 | ) | (10.0 | ) | ||||
Proceeds from receivables financing agreement | 80.0 | 84.6 | ||||||
Proceeds from revolving credit facility | 70.0 | 10.0 | ||||||
Proceeds from issuance of common stock, net of share issuance costs | 0.1 | — | ||||||
Other financing activities, net | 0.4 | — | ||||||
Net cash used in financing activities | 82.1 | (1.0 | ) | |||||
Net change in cash and cash equivalents | 48.9 | (24.0 | ) | |||||
Cash and cash equivalents, beginning of period | 39.1 | 35.2 | ||||||
Cash and cash equivalents, end of period | $ | 88.0 | $ | 11.2 | ||||
(*) Amounts may not total due to rounding. | ||||||||
BrightView Holdings, Inc. | ||||||||||||||||
Reconciliation of GAAP to Non-GAAP Financial Measures | ||||||||||||||||
(Unaudited) | ||||||||||||||||
Three Months Ended
| Six Months Ended
| |||||||||||||||
(in millions)* | 2020 | 2019 | 2020 | 2019 | ||||||||||||
Adjusted EBITDA | ||||||||||||||||
Net (loss) | $ | (20.5 | ) | $ | (3.6 | ) | $ | (33.1 | ) | $ | (12.4 | ) | ||||
Plus: | ||||||||||||||||
Interest expense, net | 17.1 | 18.9 | 34.5 | 36.1 | ||||||||||||
Income tax (benefit) | (6.7 | ) | (1.3 | ) | (11.6 | ) | (4.5 | ) | ||||||||
Depreciation expense | 19.3 | 21.7 | 39.5 | 41.0 | ||||||||||||
Amortization expense | 13.6 | 13.8 | 27.1 | 28.9 | ||||||||||||
Establish public company financial reporting compliance (a) | — | 1.3 | 0.9 | 1.7 | ||||||||||||
Business transformation and integration costs (b) | 8.9 | 4.7 | 17.3 | 8.9 | ||||||||||||
Offering-related expenses (c) | 1.2 | — | 1.5 | — | ||||||||||||
Equity-based compensation (d) | 4.9 | 5.6 | 13.3 | 11.5 | ||||||||||||
COVID-19 related expenses (e) | 1.1 | — | 1.1 | — | ||||||||||||
Adjusted EBITDA | $ | 38.9 | $ | 61.1 | $ | 90.5 | $ | 111.2 | ||||||||
Adjusted Net Income | ||||||||||||||||
Net (loss) | $ | (20.5 | ) | $ | (3.6 | ) | $ | (33.1 | ) | $ | (12.4 | ) | ||||
Plus: | ||||||||||||||||
Amortization expense | 13.6 | 13.8 | 27.1 | 28.9 | ||||||||||||
Establish public company financial reporting compliance (a) | — | 1.3 | 0.9 | 1.7 | ||||||||||||
Business transformation and integration costs (b) | 8.9 | 4.7 | 17.3 | 8.9 | ||||||||||||
Offering-related expenses (c) | 1.2 | — | 1.5 | — | ||||||||||||
Equity-based compensation (d) | 4.9 | 5.6 | 13.3 | 11.5 | ||||||||||||
COVID-19 related expenses (e) | 1.1 | — | 1.1 | — | ||||||||||||
Income tax adjustment (f) | (7.3 | ) | (6.2 | ) | (15.6 | ) | (12.6 | ) | ||||||||
Adjusted Net Income (g) | $ | 1.9 | $ | 15.6 | $ | 12.5 | $ | 26.0 | ||||||||
Free Cash Flow | ||||||||||||||||
Cash flows from operating activities | $ | 78.4 | $ | 58.3 | $ | 85.7 | $ | 64.7 | ||||||||
Minus: | ||||||||||||||||
Capital expenditures | 20.6 | 25.3 | 35.1 | 42.6 | ||||||||||||
Plus: | ||||||||||||||||
Proceeds from sale of property and equipment | 1.6 | 1.2 | 2.7 | 3.0 | ||||||||||||
Free Cash Flow | $ | 59.4 | $ | 34.2 | $ | 53.3 | $ | 25.1 | ||||||||
(*) Amounts may not total due to rounding. | ||||||||||||||||
BrightView Holdings, Inc. | ||
Reconciliation of GAAP to Non-GAAP Financial Measures | ||
(Unaudited) | ||
(a) | Represents costs incurred to establish public company financial reporting compliance, including costs to comply with the requirements of Sarbanes-Oxley and the accelerated adoption of the revenue recognition standard (ASC 606 – Revenue from Contracts with Customers), and other miscellaneous costs. | |
(b) | Business transformation and integration costs consist of (i) severance and related costs; (ii) vehicle fleet rebranding costs; (iii) business integration costs and (iv) information technology infrastructure, transformation costs, and other. | |
Three Months Ended March 31, | Six Months Ended March 31, | ||||||||||||||
(in millions)* | 2020 | 2019 | 2020 | 2019 | |||||||||||
Severance and related costs | $ | 0.4 | $ | 1.0 | $ | 0.6 | $ | 1.5 | |||||||
Rebranding of vehicle fleet | — | 0.1 | — | 0.4 | |||||||||||
Business integration | 3.5 | 2.7 | 8.9 | 3.7 | |||||||||||
IT infrastructure, transformation, and other | 5.0 | 0.9 | 7.8 | 3.3 | |||||||||||
Business transformation and integration costs | $ | 8.9 | $ | 4.7 | $ | 17.3 | $ | 8.9 | |||||||
(c) | Represents expenses incurred for IPO related litigation and subsequent registration statements. No related expenses were incurred during the three months or six months ended March 31, 2019. | |
(d) | Represents equity-based compensation expense and related taxes recognized for equity incentive plans outstanding, including $1.9 and $3.9 million of equity based compensation expense related to the IPO in the three and six months ended March 31, 2020, respectively. | |
(e) | Represents expenses related to the Company’s response to the COVID-19 pandemic, primarily for purchases of additional supplies. | |
(f) | Represents the tax effect of pre-tax items excluded from Adjusted Net Income and the removal of the applicable discrete tax items, which collectively result in a reduction of income tax. The tax effect of pre-tax items excluded from Adjusted Net Income is computed using the statutory rate related to the jurisdiction that was impacted by the adjustment after taking into account the impact of permanent differences and valuation allowances. Discrete tax items include changes in laws or rates, changes in uncertain tax positions relating to prior years and changes in valuation allowances. |
Three Months Ended
| Six Months Ended
| ||||||||||||||
(in millions)* | 2020 | 2019 | 2020 | 2019 | |||||||||||
Tax impact of pre-tax income adjustments | $ | 7.3 | $ | 6.1 | $ | 15.3 | $ | 11.9 | |||||||
Discrete tax items | — | 0.1 | 0.3 | 0.7 | |||||||||||
Income tax adjustment | $ | 7.3 | $ | 6.2 | $ | 15.6 | $ | 12.6 | |||||||
(g) | Adjusted EPS is defined as Adjusted Net Income divided by the weighted average number of common shares outstanding for the period used in the calculation of basic EPS. |
Total Financial Debt and Total Financial Net Debt | ||||||||||||
(in millions)* | March 31,
| March 31,
| September 30,
| |||||||||
Long-term debt, net | $ | 1,220.8 | $ | 1,147.5 | $ | 1,134.2 | ||||||
Plus: | ||||||||||||
Current portion of long-term debt | 10.4 | 10.4 | 10.4 | |||||||||
Financing costs, net | 15.5 | 18.9 | 17.1 | |||||||||
Present value of net minimum payment - finance/capital lease obligations | 7.7 | 8.6 | 8.5 | |||||||||
Total Financial Debt | 1,254.4 | 1,185.3 | 1,170.2 | |||||||||
Less: Cash and cash equivalents | (88.0 | ) | (11.2 | ) | (39.1 | ) | ||||||
Total Net Financial Debt | $ | 1,166.4 | $ | 1,174.1 | $ | 1,131.1 | ||||||
Total Net Financial Debt to Adjusted EBITDA ratio | 4.1x | 4.0x | 3.7x | |||||||||
(*) Amounts may not total due to rounding. | ||||||||||||
View source version on businesswire.com: https://www.businesswire.com/news/home/20200507005220/en/
Contacts:
John E. Shave, VP of Investor Relations
484.567.7148
John.Shave@BrightView.com
