

BrightView Holdings, Inc. (NYSE: BV) (the “Company” or “BrightView”), the leading commercial landscaping services company in the United States, today reported unaudited results for the first quarter ended December 31, 2019.
This press release features multimedia. View the full release here: https://www.businesswire.com/news/home/20200206005104/en/
(Graphic: Business Wire)
First Quarter Fiscal 2020 Highlights
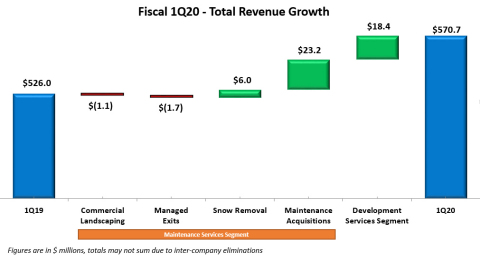
- Total Revenues for the quarter were $570.7 million, an 8.5% increase versus the prior year, with 6.7% higher Maintenance Services Segment revenues and 13.7% higher Development Services Segment revenues;
- Net Loss of $12.6 million, or $(0.12) per share, and a net loss margin of 2.2%, compared to Net Loss of $8.8 million, or $(0.09) per share, and a net loss margin of 1.7%, in the prior year;
- Adjusted EBITDA of $51.7 million and Adjusted EBITDA margin of 9.1%, compared to Adjusted EBITDA of $50.1 million and Adjusted EBITDA margin of 9.5% in the prior year;
- Adjusted Net Income of $10.6 million, or $0.10 per share, compared to Adjusted Net Income of $10.4 million, or $0.10 per share, in the prior year.
“We are pleased with our start to fiscal 2020. We saw another quarter of solid revenue growth in both operating segments and overall Adjusted EBITDA growth for the Enterprise. Our net new sales, which will benefit the upcoming ‘green’ maintenance season, are the highest ever generated; our development project bookings are ahead of last year’s pace and our strong-on-strong acquisition strategy already has to date added four companies with enough expected revenue impact to reach our full year fiscal 2020 targets,” said Andrew Masterman, BrightView President and Chief Executive Officer. “We also continue to make our planned investments in people and technology to support our sales and account manager teams, enhancing our customer relationships and driving both revenue growth and cash generation, that will drive continued value creation for our stockholders.”
Adjusted EBITDA, Adjusted EBITDA Margin, Adjusted Net Income, Free Cash Flow and Adjusted Earnings per Share are non-GAAP measures. Refer to the “Non-GAAP Financial Measures” and “Reconciliation of GAAP to Non-GAAP Financial Measures” sections for more information.
Fiscal 2020 Results – Total BrightView
Total BrightView - Operating Highlights | ||||||||||
Three Months Ended
| ||||||||||
($ in millions, except per share figures) | 2019 | 2018 | Change | |||||||
Revenue | $ | 570.7 | $ | 526.0 | 8.5% | |||||
Net Loss | $ | (12.6 | ) | $ | (8.8 | ) | 43.2% | |||
Net Loss Margin | (2.2 | %) | (1.7 | %) | 29.4% | |||||
Adjusted EBITDA | $ | 51.7 | $ | 50.1 | 3.2% | |||||
Adjusted EBITDA Margin | 9.1 | % | 9.5 | % | -40 bps | |||||
Adjusted Net Income | $ | 10.6 | $ | 10.4 | 1.9% | |||||
Earnings per Share, GAAP | $ | (0.12 | ) | $ | (0.09 | ) | (33.3%) | |||
Earnings per Share, Adjusted | $ | 0.10 | $ | 0.10 | — | |||||
Weighted average number of common shares outstanding | 103.3 | 102.5 | 0.8% | |||||||
For the first quarter of fiscal 2020, total revenue increased 8.5% to $570.7 million due to increases in both Maintenance Services Segment and Development Services Segment revenues. Net Loss was $12.6 million compared to $8.8 million in the 2018 period, attributable to lower income from operations, partially offset by an increase in other income and an increase in the income tax benefit. Total Adjusted EBITDA increased 3.2% driven by an increase in Development Services Segment Adjusted EBITDA, coupled with lower corporate expenses, partially offset by a decrease in Maintenance Services Segment Adjusted EBITDA, as discussed further below.
Fiscal 2020 Results – Segments
Maintenance Services - Operating Highlights | ||||||||||
Three Months Ended
| ||||||||||
($ in millions) | 2019 | 2018 | Change | |||||||
Landscape Maintenance | $ | 363.3 | $ | 344.5 | 5.5% | |||||
Snow Removal | $ | 55.6 | $ | 48.0 | 15.8% | |||||
Total Revenue | $ | 418.9 | $ | 392.5 | 6.7% | |||||
Adjusted EBITDA | $ | 47.7 | $ | 48.7 | (2.1%) | |||||
Adjusted EBITDA Margin | 11.4 | % | 12.4 | % | -100 bps | |||||
Capital Expenditures | $ | 11.7 | $ | 11.1 | 5.4% | |||||
For the first quarter fiscal 2020, revenue in the Maintenance Services Segment increased 6.7% to $418.9 million. Acquisitions added 5.9% and snow removal services added 1.5% but these increases were partially offset by a 0.7% negative revenue contribution from commercial landscaping which included lower revenue due to the wind down of Managed Exits and the timing of new contracts.
Adjusted EBITDA for the Maintenance Services Segment in the quarter decreased 2.1% to $47.7 million, with the Adjusted EBITDA Margin decreasing 100 basis points versus the prior year. The decrease in Adjusted EBITDA Margin was principally due to an increase in employee and technology related costs, primarily driven by the timing of expenses related to incentive compensation and the increased investment in our sales and operational leadership teams.
Development Services - Operating Highlights | ||||||||||
Three Months Ended
| ||||||||||
($ in millions) | 2019 | 2018 | Change | |||||||
Revenue | $ | 152.8 | $ | 134.4 | 13.7% | |||||
Adjusted EBITDA | $ | 19.1 | $ | 17.0 | 12.4% | |||||
Adjusted EBITDA Margin | 12.5 | % | 12.6 | % | -10 bps | |||||
Capital Expenditures | $ | 2.0 | $ | 3.2 | (37.5%) | |||||
For the first quarter fiscal 2020, revenue in the Development Services Segment increased 13.7% to $152.8 million. Project revenue, derived from the segment’s revenue growth in key markets and strong project pipeline, drove the result.
Adjusted EBITDA for the Development Services Segment increased 12.4% to $19.1 million in the quarter, positively affected by the increase in net revenue described above. Segment Adjusted EBITDA margin was relatively flat compared with the prior year period.
Total BrightView Cash Flow Metrics | ||||||||||
Three Months Ended
| ||||||||||
($ in millions) | 2019 | 2018 | Change | |||||||
Cash Provided by Operating Activities | $ | 7.3 | $ | 6.4 | 14.1% | |||||
Free Cash Flow | $ | (6.2 | ) | $ | (9.1 | ) | 31.9% | |||
Capital Expenditures | $ | 14.5 | $ | 17.3 | (16.2%) | |||||
Net cash provided by operating activities for the quarter ended December 31, 2019 was $7.3 million, compared to $6.4 million for the prior year. This increase was primarily due to an increase in cash provided by unbilled and deferred revenue coupled with a decrease in cash used by accounts payable and other operating liabilities, mostly offset by a decrease in cash provided by accounts receivable and an increase in cash used by other operating assets.
Free Cash Flow for the quarter ended December 31, 2019 was $(6.2) million, an increase of $2.9 million versus the prior year. The increase in Free Cash Flow was driven principally by a decline in capital expenditures of $2.8 million.
For the quarter ended December 31, 2019, capital expenditures were $14.5 million, compared with $17.3 million in the prior year. The Company also generated proceeds from the sale of property and equipment of $1.0 million and $1.8 million in the first quarter of fiscal 2020 and 2019, respectively. Net of the proceeds from the sale of property and equipment in the quarter, net capital expenditures represented 2.4% and 2.9% of revenue in the first quarter fiscal 2020 and 2019, respectively.
Total BrightView Balance Sheet Metrics | |||||||||||
($ in millions) | December 31,
| December 31,
| September 30,
| ||||||||
Total Financial Debt1 | $ | 1,165.4 | $ | 1,179.1 | $ | 1,170.2 | |||||
Total Cash & Equivalents | $ | 10.3 | $ | 17.7 | $ | 39.1 | |||||
Total Net Financial Debt2 to Adjusted EBITDA ratio | 3.8x | 4.1x | 3.7x | ||||||||
1Total Financial Debt includes total long-term debt, net of original issue discount, and capital lease obligations | |||||||||||
2Total Net Financial Debt equals Total Financial Debt minus Total Cash & Equivalents | |||||||||||
As of December 31, 2019, the Company’s Total Net Financial Debt was $1,155.1 million, a decrease of $6.3 million compared to $1,161.4 million as of December 31, 2018. The Company’s Total Net Financial Debt to Adjusted EBITDA ratio was 3.8x as of December 31, 2019, compared with 4.1x as of December 31, 2018.
Recent Developments
Acquisition of Signature Coast Holdings, LLC
In January, BrightView acquired Signature Coast Holdings, LLC. (“Signature Coast”) a commercial landscaping company headquartered in Napa, CA. Terms of the transaction were not disclosed.
Signature Coast’s operations span nine strategic locations in both California (Concord, Davis, Marin, Napa, Rocklin, Sacramento and Santa Rosa) and Nevada (Carson City and Reno). The Company provides landscape maintenance, irrigation, enhancement, installation, arbor care, pest control and snow removal services under its three major brands: Coast Landscape Management, Signature Landscapes and C&R Landscape. The Company’s 600 trained and qualified landscape professionals serve clients across the corporate, HOA, multi-family and municipal segments.
Acquisition of Summit Landscape Group, LLC
In January, BrightView acquired Summit Landscape Group, LLC (“Summit”), a commercial landscaping company headquartered in Rock Hill, SC. Terms of the transaction were not disclosed.
Established in 2011, Summit has built a strong reputation among its clients for providing each of them with a comprehensive landscape solution and delivering outstanding workmanship and service beyond expectations. By taking a proactive, practical and responsive approach to customer service, Summit has set itself apart in each of the markets it serves: Charlotte (NC), Charleston and Hilton Head (SC) and Nashville (TN). The team of approximately 180 trained and skilled landscape professionals holds certifications to offer a full suite of landscaping services including, turf management, agronomics, tree and plant care, landscape design and install, irrigation install and repair, outdoor living (hardscapes), landscape lighting, erosion control, storm water control and inspection, soil stabilization, grading and snow and ice removal.
Conference Call Information
A conference call to discuss the first quarter fiscal 2020 financial results is scheduled for February 6, 2020, at 10 a.m. EST. The U.S. toll free dial-in for the conference call is (877) 273-7124 and the international dial-in is (647) 689-5396. The conference passcode is 8507717. A live audio webcast of the conference call will be available on the Company’s investor website https://investor.brightview.com, where presentation materials will be posted prior to the call.
A telephone replay will be available shortly after the broadcast through February 13, 2020, by dialing (800) 585-8367 from the U.S., and entering conference passcode 8507717. A replay of the audio webcast also will be archived on the Company’s investor website.
About BrightView
BrightView is the largest provider of commercial landscaping services in the United States. Through its team of approximately 21,500 employees, BrightView provides services ranging from landscape maintenance and enhancements to tree care and landscape development for thousands of customers’ properties, including corporate and commercial properties, HOAs, public parks, hotels and resorts, hospitals and other healthcare facilities, educational institutions, restaurants and retail, and golf courses, among others. BrightView is the Official Field Consultant to Major League Baseball.
Forward Looking Statements
This press release contains forward-looking statements within the meaning of Section 27A of the Securities Act of 1933, as amended (the “Securities Act”) and Section 21E of the Securities Exchange Act of 1934. These statements include, but are not limited to, statements relating to our 2020 Fiscal Year Outlook, statements related to our expectations regarding the performance of our industry, growth strategy, goals and expectations concerning our market position, future operations, margins, profitability, capital expenditures, liquidity and capital resources and other financial and operating information. You can identify these forward-looking statements by the use of words such as “outlook,” “guidance,” “believes,” “expects,” “potential,” “continues,” “may,” “will,” “should,” “could,” “seeks,” “projects,” “predicts,” “intends,” “plans,” “estimates,” “anticipates” or the negative version of these words or other comparable words. Such forward-looking statements are subject to various risks, uncertainties and factors, including general business, economic and financial conditions; competitive industry pressures; the failure to retain current customers, renew existing customer contracts and obtain new customer contracts; the failure to enter into profitable contracts, or maintaining customer contracts that are unprofitable; a determination by customers to reduce their outsourcing or use of preferred vendors; the dispersed nature of our operating structure; our ability to implement our business strategies and achieve our growth objectives; acquisition and integration risks; the seasonal nature of our landscape maintenance services; our dependence on weather conditions; increases in prices for raw materials and fuel; product shortages and the loss of key suppliers; our ability to accurately estimate costs of a contract; the conditions and periodic fluctuations of real estate markets, including residential and commercial construction; our ability to retain our executive management and other key personnel; our ability to attract and retain trained workers and third-party contractors and re-employ seasonal workers; any failure to properly verify employment eligibility of our employees; subcontractors taking actions that harm our business; our recognition of future impairment charges; laws and governmental regulations, including those relating to employees, wage and hour, immigration, human health and safety and transportation; environmental, health and safety laws and regulations, including regulatory costs, claims and litigation related to the use of chemicals and pesticides by employees and related third-party claims; the distraction and impact caused by litigation, of adverse litigation judgments or settlements resulting from legal proceedings; increase in on-job accidents involving employees; any failure, inadequacy, interruption, security failure or breach of our information technology systems; any failure to protect the security of personal information about our customers, employees and third parties; our ability to adequately protect our intellectual property; occurrence of natural disasters, terrorist attacks or other external events; our ability to generate sufficient cash flow to satisfy our significant debt service obligations; our ability to obtain additional financing to fund future working capital, capital expenditures, investments or acquisitions, or other general corporate requirements; restrictions imposed by our debt agreements that limit our flexibility in operating our business; increases in interest rates governing our variable rate indebtedness increasing the cost of servicing our substantial indebtedness including proposed changes to LIBOR; and counterparty credit worthiness risk or risk of non-performance with respect to derivative financial instruments. Additional factors that could cause BrightView’s results to differ materially from those described in the forward-looking statements can be found under “Item 1A. Risk Factors” in our Form 10-K for the fiscal year ended September 30, 2019, and our quarterly report on Form 10-Q for the first quarter fiscal 2020, as such factors may be updated from time to time in our periodic filings with the SEC, which are accessible on the SEC’s website at www.sec.gov. Accordingly, there are or will be important factors that could cause actual outcomes or results to differ materially from those indicated in these statements. These factors should not be construed as exhaustive and should be read in conjunction with the other cautionary statements that are included in this release and in our filings with the SEC. Any forward-looking statement made in this press release speaks only as of the date on which it was made. We undertake no obligation to publicly update or review any forward-looking statement, whether as a result of new information, future developments or otherwise, except as required by law.
Non-GAAP Financial Measures
To supplement the Company’s financial information presented in accordance with GAAP and aid understanding of the Company’s business performance, the Company uses certain non-GAAP financial measures, namely “Adjusted EBITDA”, “Adjusted EBITDA Margin”, “Adjusted Net Income” “Adjusted Earnings per Share”, “Free Cash Flow”, Total Financial Debt” and “Total Net Financial Debt”. We believe Adjusted EBITDA, Adjusted EBITDA Margin, Adjusted Net Income, Adjusted Earnings per Share, Free Cash Flow, Total Financial Debt and Total Net Financial Debt assist investors and in comparing our results across reporting periods on a consistent basis by excluding items that we do not believe are indicative of our core operating performance. Management believes these non-GAAP financial measures are useful to investors in highlighting trends in our operating performance, while other measures can differ significantly depending on long-term strategic decisions regarding capital structure, the tax jurisdictions in which we operate and capital investments. Management regularly uses these measures as tools in evaluating our operating performance, financial performance and liquidity. Management uses Adjusted EBITDA, Adjusted EBITDA Margin, Adjusted Net Income, Adjusted Earnings per Share, Free Cash Flow, Total Financial Debt and Total Net Financial Debt to supplement comparable GAAP measures in the evaluation of the effectiveness of our business strategies, to make budgeting decisions, to establish discretionary annual incentive compensation and to compare our performance against that of other peer companies using similar measures. In addition, we believe that Adjusted EBITDA, Adjusted EBITDA Margin, Adjusted Net Income, Adjusted Net Income per Share, Free Cash Flow, Total Financial Debt and Total Net Financial Debt are frequently used by investors and other interested parties in the evaluation of issuers, many of which also present Adjusted EBITDA, Adjusted EBITDA Margin, Adjusted Net Income, Adjusted Earnings per Share, Free Cash Flow, Total Financial Debt and Total Net Financial Debt when reporting their results in an effort to facilitate an understanding of their operating and financial results and liquidity. Management supplements GAAP results with non-GAAP financial measures to provide a more complete understanding of the factors and trends affecting the business than GAAP results alone.
Adjusted EBITDA: We define Adjusted EBITDA as net income (loss) before interest, taxes, depreciation and amortization, as further adjusted to exclude certain non-cash, non-recurring and other adjustment items.
Adjusted EBITDA Margin: We define Adjusted EBITDA Margin as Adjusted EBITDA, defined above, divided by Net Service Revenues.
Adjusted Net Income: We define Adjusted Net Income as net income (loss) including interest and depreciation, and excluding other items used to calculate Adjusted EBITDA and further adjusted for the tax effect of these exclusions and the removal of the discrete tax items.
Adjusted Earnings per Share: We define Adjusted Earnings per Share as Adjusted Net Income divided by the weighted average number of common shares outstanding for the period.
Free Cash Flow: We define Free Cash Flow as cash flows from operating activities less capital expenditures, net of proceeds from the sale of property and equipment.
Total Financial Debt: We define Total Financial Debt as total long-term debt, net of original issue discount, and capital lease obligations.
Total Net Financial Debt: We define Total Net Financial Debt as Total Financial Debt minus total cash and cash equivalents.
Adjusted EBITDA, Adjusted EBITDA Margin, Adjusted Net Income, Adjusted Earnings per Share, Free Cash Flow, Total Financial Debt, and Total Net Financial Debt are not recognized terms under GAAP and should not be considered as an alternative to net income (loss) or the ratio of net income (loss) to net revenue as a measure of financial performance, cash flows provided by operating activities as a measure of liquidity, or any other performance measure derived in accordance with GAAP. Additionally, these measures are not intended to be a measure of free cash flow available for management’s discretionary use as they do not consider certain cash requirements such as interest payments, tax payments and debt service requirements. The presentations of these measures have limitations as analytical tools and should not be considered in isolation, or as a substitute for analysis of our results as reported under GAAP. Because not all companies use identical calculations, the presentations of these measures may not be comparable to other similarly titled measures of other companies and can differ significantly from company to company.
BrightView Holdings, Inc. | ||||||||
Consolidated Balance Sheets | ||||||||
(Unaudited) | ||||||||
(in millions)* | December 31,
| September 30,
| ||||||
Assets | ||||||||
Current assets: | ||||||||
Cash and cash equivalents | $ | 10.3 | $ | 39.1 | ||||
Accounts receivable, net | 363.9 | 333.7 | ||||||
Unbilled revenue | 84.9 | 107.6 | ||||||
Inventories | 28.4 | 26.5 | ||||||
Other current assets | 55.1 | 44.5 | ||||||
Total current assets | 542.6 | 551.4 | ||||||
Property and equipment, net | 268.6 | 272.4 | ||||||
Intangible assets, net | 242.2 | 251.5 | ||||||
Goodwill | 1,823.0 | 1,810.4 | ||||||
Operating lease assets | 65.0 | — | ||||||
Other assets | 45.5 | 42.9 | ||||||
Total assets | 2,986.9 | 2,928.6 | ||||||
Liabilities and Stockholders’ Equity | ||||||||
Current liabilities: | ||||||||
Accounts payable | $ | 109.3 | $ | 99.8 | ||||
Current portion of long-term debt | 10.4 | 10.4 | ||||||
Deferred revenue | 66.5 | 49.1 | ||||||
Current portion of self-insurance reserves | 41.7 | 37.4 | ||||||
Accrued expenses and other current liabilities | 111.5 | 136.0 | ||||||
Current portion of operating lease liabilities | 23.3 | — | ||||||
Total current liabilities | 362.7 | 332.7 | ||||||
Long-term debt, net | 1,132.5 | 1,134.2 | ||||||
Deferred tax liabilities | 60.3 | 64.4 | ||||||
Self-insurance reserves | 84.7 | 87.1 | ||||||
Long-term operating lease liabilities | 48.0 | — | ||||||
Other liabilities | 15.6 | 26.4 | ||||||
Total liabilities | 1,703.8 | 1,644.8 | ||||||
Stockholders’ equity: | ||||||||
Preferred stock, $0.01 par value; 50,000,000 shares authorized; no shares issued or outstanding as of December 31, 2019 and September 30, 2019 | — | — | ||||||
Common stock, $0.01 par value; 500,000,000 shares authorized; 104,845,000 and 104,700,000 shares issued and outstanding as of December 31, 2019 and September 30, 2019, respectively | 1.0 | 1.0 | ||||||
Treasury stock, at cost; 91,000 and 52,000 shares as of December 31, 2019 and September 30, 2019, respectively | (1.7 | ) | (1.0 | ) | ||||
Additional paid-in-capital | 1,452.3 | 1,441.8 | ||||||
Accumulated deficit | (158.9 | ) | (146.3 | ) | ||||
Accumulated other comprehensive loss | (9.6 | ) | (11.7 | ) | ||||
Total stockholders’ equity | 1,283.1 | 1,283.8 | ||||||
Total liabilities and stockholders’ equity | $ | 2,986.9 | $ | 2,928.6 | ||||
(*) Amounts may not total due to rounding. | ||||||||
BrightView Holdings, Inc. | ||||||||
Consolidated Statements of Operations | ||||||||
(Unaudited) | ||||||||
Three Months Ended
| ||||||||
2019 | 2018 | |||||||
(in millions)* | ||||||||
Net service revenues | $ | 570.7 | $ | 526.0 | ||||
Cost of services provided | 427.7 | 394.1 | ||||||
Gross profit | 143.0 | 131.9 | ||||||
Selling, general and administrative expense | 130.3 | 110.2 | ||||||
Amortization expense | 13.5 | 15.1 | ||||||
(Loss) income from operations | (0.8 | ) | 6.6 | |||||
Other income (expense) | 0.7 | (1.5 | ) | |||||
Interest expense | 17.4 | 17.1 | ||||||
(Loss) before income taxes | (17.5 | ) | (12.0 | ) | ||||
Income tax benefit | 4.9 | 3.2 | ||||||
Net (loss) | $ | (12.6 | ) | $ | (8.8 | ) | ||
(Loss) per share: | ||||||||
Basic and diluted | $ | (0.12 | ) | $ | (0.09 | ) | ||
BrightView Holdings, Inc. | ||||||||
Segment Reporting | ||||||||
(Unaudited) | ||||||||
Three Months Ended
| ||||||||
2019 | 2018 | |||||||
(in millions)* | ||||||||
Maintenance Services | $ | 418.9 | $ | 392.5 | ||||
Development Services | 152.8 | 134.4 | ||||||
Eliminations | (1.0 | ) | (0.9 | ) | ||||
Net Service Revenues | $ | 570.7 | $ | 526.0 | ||||
Maintenance Services | $ | 47.7 | $ | 48.7 | ||||
Development Services | 19.1 | 17.0 | ||||||
Corporate | (15.1 | ) | (15.6 | ) | ||||
Adjusted EBITDA | $ | 51.7 | $ | 50.1 | ||||
Maintenance Services | $ | 11.7 | $ | 11.1 | ||||
Development Services | 2.0 | 3.2 | ||||||
Corporate | 0.8 | 3.0 | ||||||
Capital Expenditures | $ | 14.5 | $ | 17.3 | ||||
(*) Amounts may not total due to rounding. | ||||||||
BrightView Holdings, Inc. | ||||||||
Consolidated Statements of Cash Flows | ||||||||
(Unaudited) | ||||||||
Three Months Ended
| ||||||||
2019 | 2018 | |||||||
(in millions)* | ||||||||
Cash flows from operating activities: | ||||||||
Net (loss) | $ | (12.6 | ) | $ | (8.8 | ) | ||
Adjustments to reconcile net (loss) to net cash provided by operating activities: | ||||||||
Depreciation | 20.2 | 19.3 | ||||||
Amortization of intangible assets | 13.5 | 15.1 | ||||||
Amortization of financing costs and original issue discount | 0.9 | 0.9 | ||||||
Deferred taxes | (4.9 | ) | (3.8 | ) | ||||
Equity-based compensation | 8.2 | 5.9 | ||||||
Other non-cash activities, net | 2.3 | 0.2 | ||||||
Change in operating assets and liabilities: | ||||||||
Accounts receivable | (29.6 | ) | 18.3 | |||||
Unbilled and deferred revenue | 40.3 | 9.6 | ||||||
Inventories | (1.7 | ) | (1.2 | ) | ||||
Other operating assets | (12.4 | ) | (0.5 | ) | ||||
Accounts payable and other operating liabilities | (16.9 | ) | (48.6 | ) | ||||
Net cash provided by operating activities | 7.3 | 6.4 | ||||||
Cash flows from investing activities: | ||||||||
Purchase of property and equipment | (14.5 | ) | (17.3 | ) | ||||
Proceeds from sale of property and equipment | 1.0 | 1.8 | ||||||
Business acquisitions, net of cash acquired | (18.4 | ) | (1.9 | ) | ||||
Other investing activities, net | — | 0.2 | ||||||
Net cash used in investing activities | (31.9 | ) | (17.2 | ) | ||||
Cash flows from financing activities: | ||||||||
Repayments of finance lease obligations | (1.5 | ) | (1.5 | ) | ||||
Repayments of debt | (12.6 | ) | (5.2 | ) | ||||
Proceeds from receivables financing agreement | 10.0 | — | ||||||
Other financing activities, net | (0.1 | ) | — | |||||
Net cash used in financing activities | (4.2 | ) | (6.7 | ) | ||||
Net change in cash and cash equivalents | (28.8 | ) | (17.5 | ) | ||||
Cash and cash equivalents, beginning of period | 39.1 | 35.2 | ||||||
Cash and cash equivalents, end of period | $ | 10.3 | $ | 17.7 | ||||
(*) Amounts may not total due to rounding. | ||||||||
BrightView Holdings, Inc. | ||||||||
Reconciliation of GAAP to Non-GAAP Financial Measures | ||||||||
(Unaudited) | ||||||||
Three Months Ended
| ||||||||
(in millions)* | 2019 | 2018 | ||||||
Adjusted EBITDA | ||||||||
Net (loss) | $ | (12.6 | ) | $ | (8.8 | ) | ||
Plus: | ||||||||
Interest expense, net | 17.4 | 17.1 | ||||||
Income tax (benefit) | (4.9 | ) | (3.2 | ) | ||||
Depreciation expense | 20.2 | 19.3 | ||||||
Amortization expense | 13.5 | 15.1 | ||||||
Establish public company financial reporting compliance (a) | 0.9 | 0.4 | ||||||
Business transformation and integration costs (b) | 8.3 | 4.3 | ||||||
Offering-related expenses (c) | 0.4 | — | ||||||
Equity-based compensation (d) | 8.5 | 5.9 | ||||||
Adjusted EBITDA | $ | 51.7 | $ | 50.1 | ||||
Adjusted Net Income | ||||||||
Net (loss) | $ | (12.6 | ) | $ | (8.8 | ) | ||
Plus: | ||||||||
Amortization expense | 13.5 | 15.1 | ||||||
Establish public company financial reporting compliance (a) | 0.9 | 0.4 | ||||||
Business transformation and integration costs (b) | 8.3 | 4.3 | ||||||
Offering-related expenses (c) | 0.4 | — | ||||||
Equity-based compensation (d) | 8.5 | 5.9 | ||||||
Income tax adjustment (e) | (8.4 | ) | (6.5 | ) | ||||
Adjusted Net Income (f) | $ | 10.6 | $ | 10.4 | ||||
Free Cash Flow | ||||||||
Cash flows from operating activities | $ | 7.3 | $ | 6.4 | ||||
Minus: | ||||||||
Capital expenditures | 14.5 | 17.3 | ||||||
Plus: | ||||||||
Proceeds from sale of property and equipment | 1.0 | 1.8 | ||||||
Free Cash Flow | $ | (6.2 | ) | $ | (9.1 | ) | ||
(*) Amounts may not total due to rounding. | ||||||||
BrightView Holdings, Inc. | ||
Reconciliation of GAAP to Non-GAAP Financial Measures | ||
(Unaudited) | ||
(a) | Represents costs incurred to establish public company financial reporting compliance, including costs to comply with the requirements of Sarbanes-Oxley and the accelerated adoption of the revenue recognition standard (ASC 606 – Revenue from Contracts with Customers), and other miscellaneous costs. | |
(b) | Business transformation and integration costs consist of (i) severance and related costs; (ii) vehicle fleet rebranding costs; (iii) business integration costs and (iv) information technology infrastructure transformation costs and other. | |
Three Months Ended
| ||||||||
(in millions)* | 2019 | 2018 | ||||||
Severance and related costs | $ | 0.2 | $ | 0.5 | ||||
Rebranding of vehicle fleet | — | 0.3 | ||||||
Business integration | 5.4 | 1.1 | ||||||
IT infrastructure transformation and other | 2.7 | 2.4 | ||||||
Business transformation and integration costs | $ | 8.3 | $ | 4.3 | ||||
(c) | Represents expenses incurred for IPO related litigation and subsequent registration statements. No related expenses were incurred during the three months ended December 31, 2018. | |
(d) | Represents equity-based compensation expense and related taxes recognized for equity incentive plans outstanding, including $2.0 of equity based compensation expense related to the IPO in the three months ended December 31, 2019. | |
(e) | Represents the tax effect of pre-tax items excluded from Adjusted Net Income and the removal of the applicable discrete tax items, which collectively result in a reduction of income tax. The tax effect of pre-tax items excluded from Adjusted Net Income is computed using the statutory rate related to the jurisdiction that was impacted by the adjustment after taking into account the impact of permanent differences and valuation allowances. Discrete tax items include changes in laws or rates, changes in uncertain tax positions relating to prior years and changes in valuation allowances. |
Three Months Ended
| ||||||||
(in millions)* | 2019 | 2018 | ||||||
Tax impact of pre-tax income adjustments | $ | 8.1 | $ | 5.9 | ||||
Discrete tax items | 0.3 | 0.6 | ||||||
Income tax adjustment | $ | 8.4 | $ | 6.5 | ||||
(f) | Adjusted EPS is defined as Adjusted Net Income divided by the weighted average number of common shares outstanding for the period used in the calculation of basic EPS. |
Total Financial Debt and Total Financial Net Debt | ||||||||||||
(in millions)* | December 31,
| December 31,
| September 30,
| |||||||||
Long-term debt, net | $ | 1,132.5 | $ | 1,139.6 | $ | 1,134.2 | ||||||
Plus: | ||||||||||||
Current portion of long-term debt | $ | 10.4 | $ | 10.4 | $ | 10.4 | ||||||
Financing costs, net | 16.3 | 19.2 | 17.1 | |||||||||
Present value of net minimum payment - capital lease obligations | 6.2 | 9.9 | 8.5 | |||||||||
Total Financial Debt | $ | 1,165.4 | $ | 1,179.1 | $ | 1,170.2 | ||||||
Less: Cash and cash equivalents | (10.3 | ) | (17.7 | ) | (39.1 | ) | ||||||
Total Net Financial Debt | $ | 1,155.1 | $ | 1,161.4 | $ | 1,131.1 | ||||||
Total Net Financial Debt to Adjusted EBITDA ratio | 3.8x | 4.1x | 3.7x | |||||||||
(*) Amounts may not total due to rounding. | ||||||||||||
View source version on businesswire.com: https://www.businesswire.com/news/home/20200206005104/en/
Contacts:
Fred Jacobs, VP of Communications & Public Affairs
484.567.7244
Fred.Jacobs@BrightView.com
