So far, so predictable . And that's the way we like our markets, right? It was two weeks ago ( 2/6 ) that we prediced the market would bounce back from 2,550 to at least 2,650 (strong bounce) for the week and then, on 2/9 , we broadened our lines and came up with the following predicted range for the S&P ( /ES ) Futures using our fabulous 5% Rule™: Here's how those lines are holding up two weeks later: We're testing the top of the bounce range but remember that range tops out still only 40% back to the 30% line, which doesn't even register on the chart anymore as the trading range has narrowed – as we predicted – at the lower levels. As I said in yesterday's Morning Report , evidence suggests that 20% line may be the top of the range for rest of the year, not the bottom or even the middle and we will need to look down to the 10% line, at 2,420, for proper support after the next correction. Hopefully, we'll consolidate around there for a proper move up later in the year (assuming things hold up in the economy). This isn't about TA (I HATE TA), the 5% Rule is just a mathemetical representation of the Fundamental Value of the S&P 500 and we simply use the chart to illustrate it. Stocks can go a very long time 10% overvalued and even grow into that valuation without a correction but 20% over-valued is strething it and, as we're seeing this earnings season, we set the high-flyers up for big punishments when they miss. Here's the Big Picture on our other indexes from our Big Chart: Those 50 and 200 dmas are the only TA I do pay attention to because those represent the average that a large sampling of investors have been willing to pay for a stock (or index) and, as you can see, we're still miles over the 200-day moving averages for our indexes so, the question is, what changed in the last 50 days to justify a 10% bump in the indexes? I guess you can kind of say the taxes but, …
So far, so predictable.
And that's the way we like our markets, right? It was two weeks ago (2/6) that we prediced the market would bounce back from 2,550 to at least 2,650 (strong bounce) for the week and then, on 2/9, we broadened our lines and came up with the following predicted range for the S&P (/ES) Futures using our fabulous 5% Rule™:
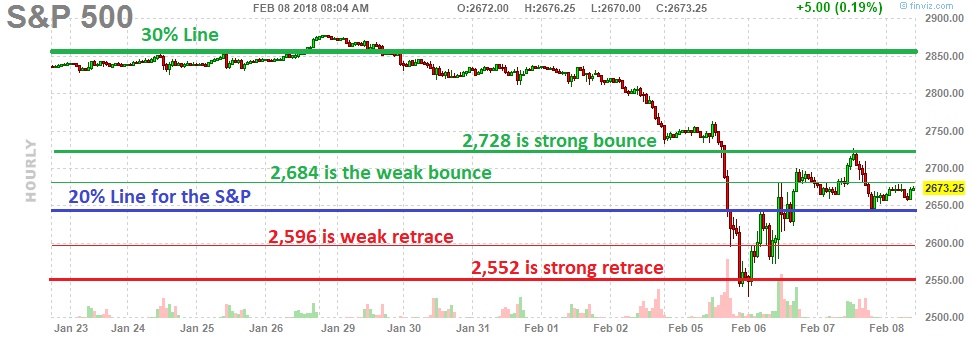
Here's how those lines are holding up two weeks later:
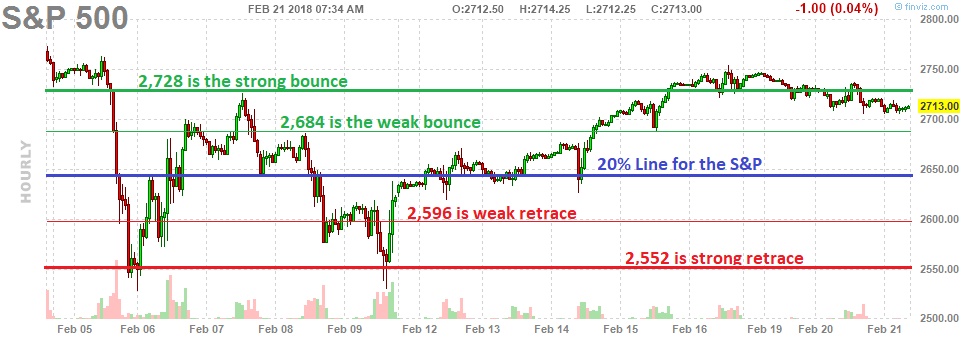
We're testing the top of the bounce range but remember that range tops out still only 40% back to the 30% line, which doesn't even register on the chart anymore as the trading range has narrowed – as we predicted – at the lower levels. As I said in yesterday's Morning Report, evidence suggests that 20% line may be the top of the range for rest of the year, not the bottom or even the middle and we will need to look down to the 10% line, at 2,420, for proper support after the next correction. Hopefully, we'll consolidate around there for a proper move up later in the year (assuming things hold up in the economy).
This isn't about TA (I HATE TA), the 5% Rule is just a mathemetical representation of the Fundamental Value of the S&P 500 and we simply use the chart to illustrate it. Stocks can go a very long time 10% overvalued and even grow into that valuation without a correction but 20% over-valued is strething it and, as we're seeing this earnings season, we set the high-flyers up for big punishments when they miss. Here's the Big Picture on our other indexes from our Big Chart:
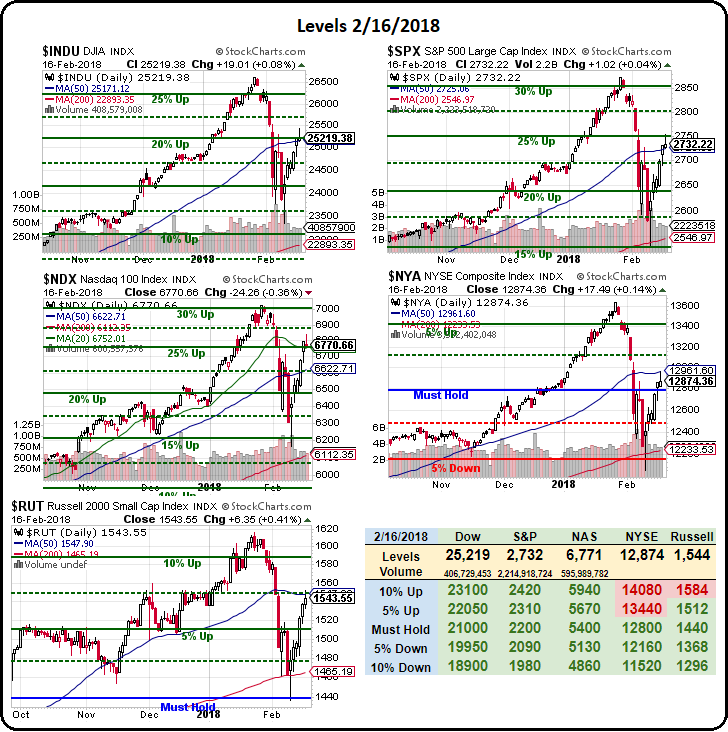
Those 50 and 200 dmas are the only TA I do pay attention to because those represent the average that a large sampling of investors have been willing to pay for a stock (or index) and, as you can see, we're still miles over the 200-day moving averages for our indexes so, the question is, what changed in the last 50 days to justify a 10% bump in the indexes? I guess you can kind of say the taxes but,…

