 Here we go again.
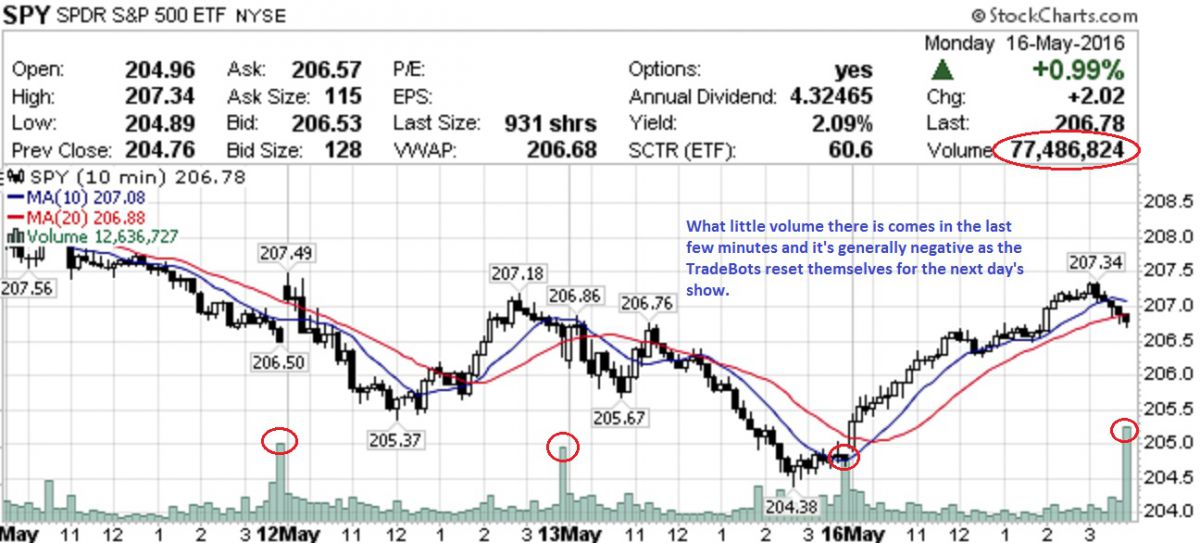
As you can see from the SPY chart, volume during yesterday's "rally" was 20% lower than even our recent low average (about 100M), which is 50% below last summers levels already and so much of the volume comes in the last 15 minutes of each day and it's generally selling as the TradeBots dump shares into whatever buyers they've managed to attract but, on the whole, the smart money is pouring OUT of the markets. In fact, $7Bn came out of stock ETFs in April while $36.7Bn went into Bond ETFs – that should tell you something.
What it doesn't tell you, however, is that $11.3Bn have flowed out of stocks in the first two weeks of May! And, as usual, what earnings season is not telling you is that, if it weren't for another record-setting round of share buybacks by the S&P 500, we'd be looking at a 7.5% earnings contraction this quarter – much worse than Q4 and guidance has not been encouraging either – so what on Earth is there to rally about?
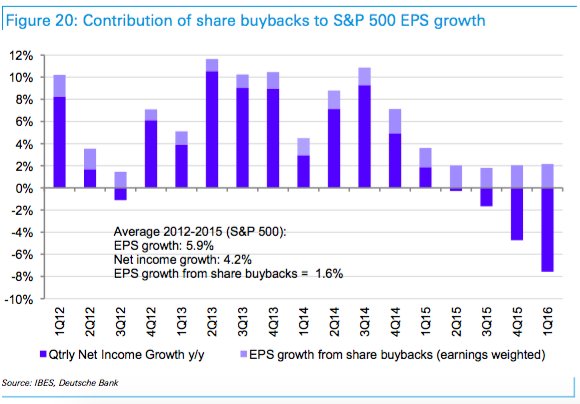
These are the net incomes per share AFTER the companies have bought back 1.6% of their shares, on average, for the past 4 years. That's 6.4% LESS shares that these earnings are being divided by and they are STILL DOWN 7.5% – that's pathetic! The effect of the buybacks should be exponentially positive to EPS over time – we're going the other way and, aside from indicating a very poor earnings environment – it's a huge red flag that most of these companies have made very poor investments by diverting so much money into their own stocks, rather than investing in turning around their businesses.
I've already put a note out to our Members to short the Futures in our Live Member Chat Room:
People are starting to notice China's debt and that's not a good thing. After a brief flirt higher, we're back to 17,650, 2,060, 4,375, 1,112.50 and 16,720 and I wouldn't use /NKD but the others all make good shorting lines to play (if 2 are under, short the laggards, look for last others to confirm and tight stops if any
…
