
Pharmaceutical company Amphastar Pharmaceuticals (NASDAQAMPH) fell short of the market’s revenue expectations in Q4 CY2025, with sales falling 1.8% year on year to $183.1 million. Its non-GAAP profit of $0.73 per share was 20.5% below analysts’ consensus estimates.
Is now the time to buy Amphastar Pharmaceuticals? Find out by accessing our full research report, it’s free.
Amphastar Pharmaceuticals (AMPH) Q4 CY2025 Highlights:
- Revenue: $183.1 million vs analyst estimates of $187.1 million (1.8% year-on-year decline, 2.2% miss)
- Adjusted EPS: $0.73 vs analyst expectations of $0.92 (20.5% miss)
- Operating Margin: 19.4%, down from 24.2% in the same quarter last year
- Market Capitalization: $1.29 billion
Company Overview
Founded in 1996 and known for its expertise in complex drug formulations, Amphastar Pharmaceuticals (NASDAQ: AMPH) develops and manufactures technically challenging injectable and inhalation medications, including both generic and proprietary pharmaceutical products.
Revenue Growth
A company’s long-term performance is an indicator of its overall quality. Any business can experience short-term success, but top-performing ones enjoy sustained growth for years. Luckily, Amphastar Pharmaceuticals’s sales grew at a solid 15.5% compounded annual growth rate over the last five years. Its growth beat the average healthcare company and shows its offerings resonate with customers.
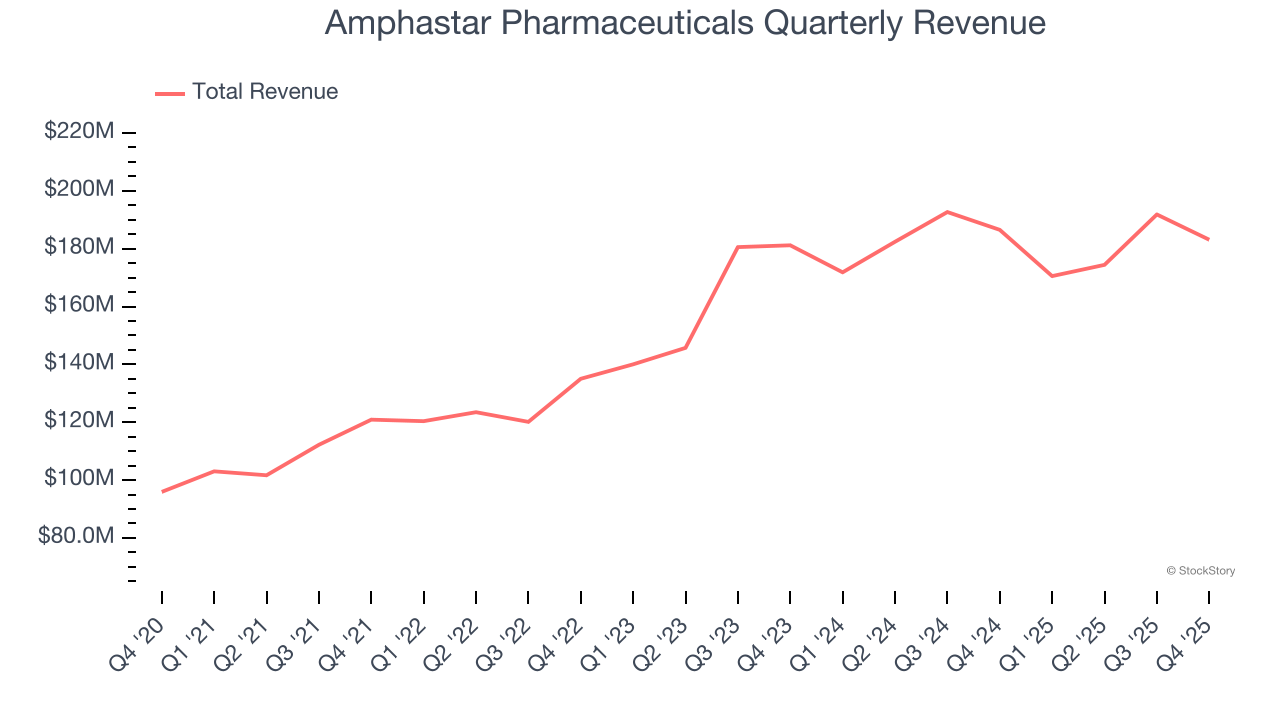
We at StockStory place the most emphasis on long-term growth, but within healthcare, a half-decade historical view may miss recent innovations or disruptive industry trends. Amphastar Pharmaceuticals’s recent performance shows its demand has slowed as its annualized revenue growth of 5.4% over the last two years was below its five-year trend. We’re wary when companies in the sector see decelerations in revenue growth, as it could signal changing consumer tastes aided by low switching costs. 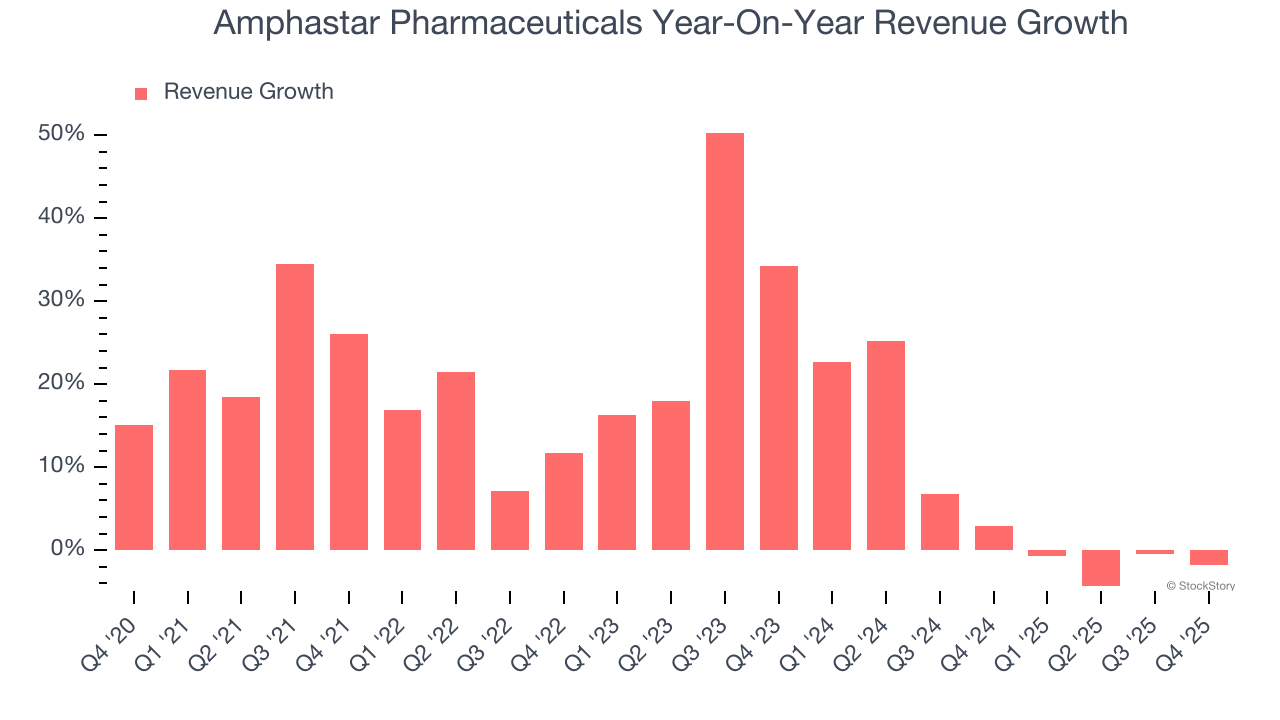
This quarter, Amphastar Pharmaceuticals missed Wall Street’s estimates and reported a rather uninspiring 1.8% year-on-year revenue decline, generating $183.1 million of revenue.
Looking ahead, sell-side analysts expect revenue to grow 11.2% over the next 12 months, an improvement versus the last two years. This projection is admirable and indicates its newer products and services will fuel better top-line performance.
While Wall Street chases Nvidia at all-time highs, an under-the-radar semiconductor supplier is dominating a critical AI component these giants can’t build without. Click here to access our free report one of our favorites growth stories.
Operating Margin
Operating margin is one of the best measures of profitability because it tells us how much money a company takes home after subtracting all core expenses, like marketing and R&D.
Amphastar Pharmaceuticals has been an efficient company over the last five years. It was one of the more profitable businesses in the healthcare sector, boasting an average operating margin of 24.5%.
Looking at the trend in its profitability, Amphastar Pharmaceuticals’s operating margin rose by 6.7 percentage points over the last five years, as its sales growth gave it operating leverage. Zooming into its more recent performance, however, we can see the company’s margin has decreased by 7.7 percentage points on a two-year basis. If Amphastar Pharmaceuticals wants to pass our bar, it must prove it can expand its profitability consistently.
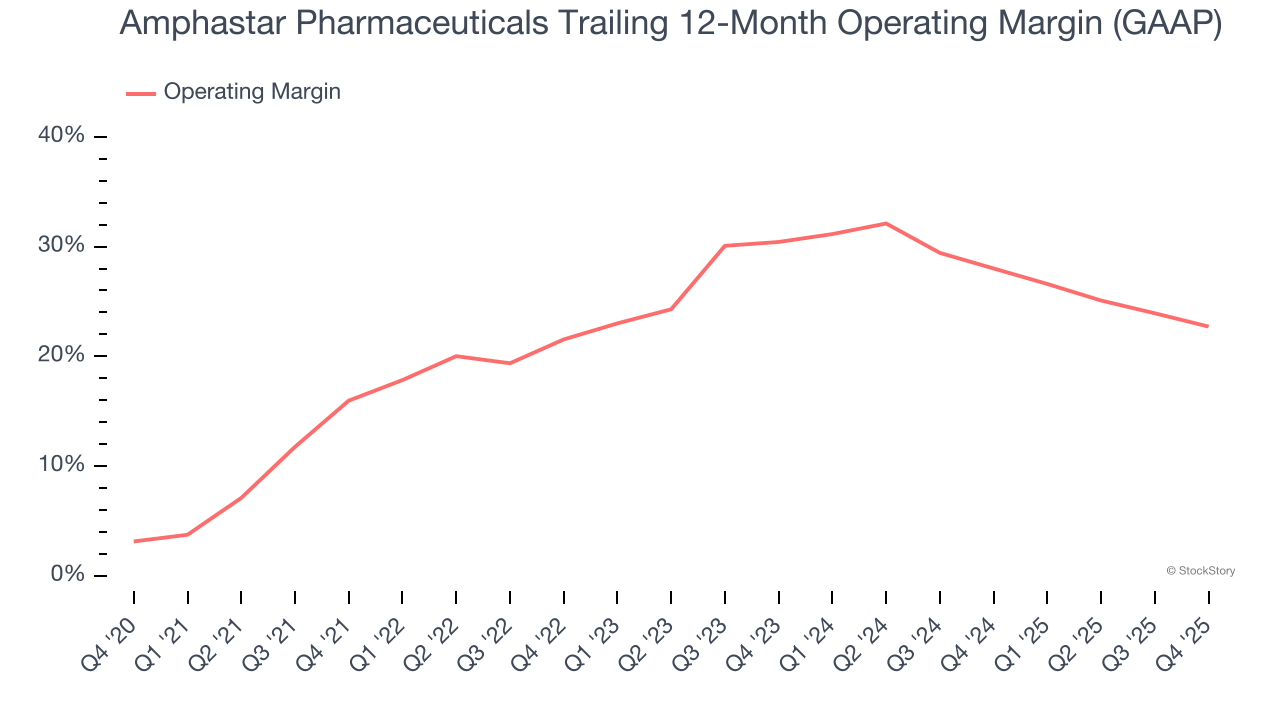
In Q4, Amphastar Pharmaceuticals generated an operating margin profit margin of 19.4%, down 4.8 percentage points year on year. This contraction shows it was less efficient because its expenses increased relative to its revenue.
Earnings Per Share
We track the long-term change in earnings per share (EPS) for the same reason as long-term revenue growth. Compared to revenue, however, EPS highlights whether a company’s growth is profitable.
Amphastar Pharmaceuticals’s EPS grew at an astounding 38.4% compounded annual growth rate over the last five years, higher than its 15.5% annualized revenue growth. This tells us the company became more profitable on a per-share basis as it expanded.
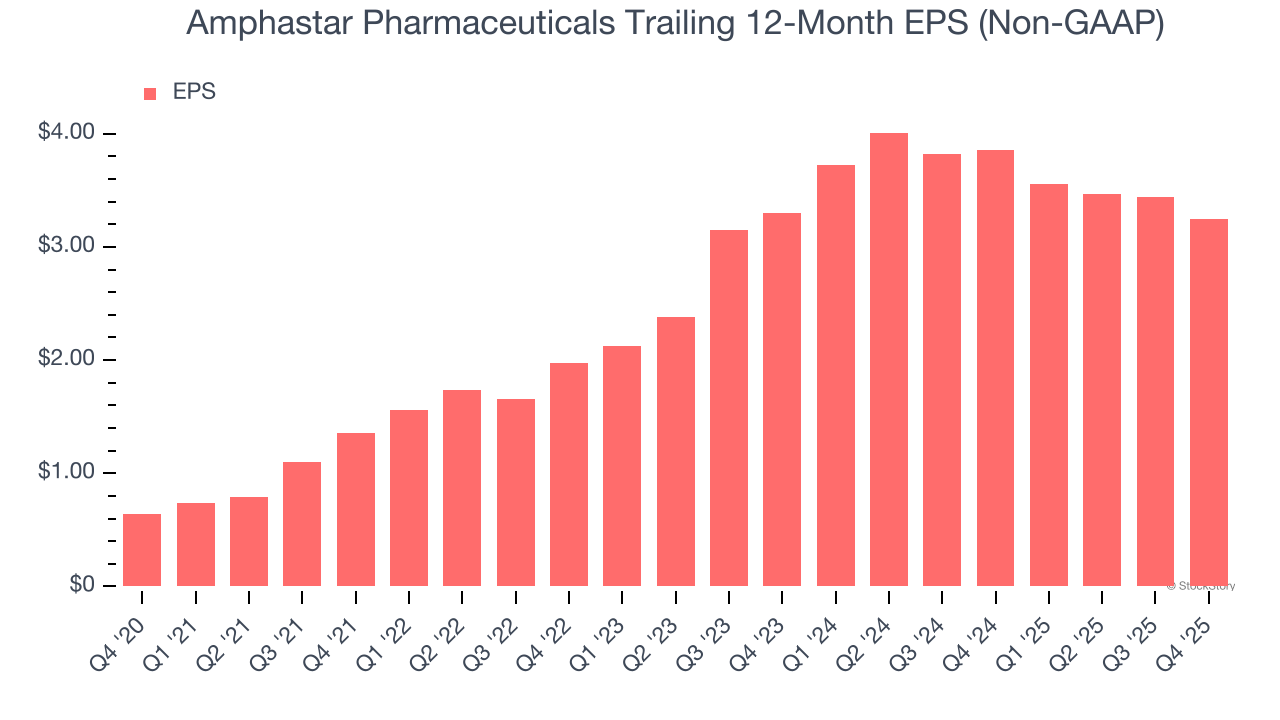
We can take a deeper look into Amphastar Pharmaceuticals’s earnings quality to better understand the drivers of its performance. As we mentioned earlier, Amphastar Pharmaceuticals’s operating margin declined this quarter but expanded by 6.7 percentage points over the last five years. This was the most relevant factor (aside from the revenue impact) behind its higher earnings; interest expenses and taxes can also affect EPS but don’t tell us as much about a company’s fundamentals.
In Q4, Amphastar Pharmaceuticals reported adjusted EPS of $0.73, down from $0.92 in the same quarter last year. This print missed analysts’ estimates, but we care more about long-term adjusted EPS growth than short-term movements. Over the next 12 months, Wall Street expects Amphastar Pharmaceuticals’s full-year EPS of $3.25 to grow 8.8%.
Key Takeaways from Amphastar Pharmaceuticals’s Q4 Results
We struggled to find many positives in these results. Its revenue missed and its EPS fell short of Wall Street’s estimates. Overall, this was a softer quarter. The stock traded down 11.7% to $23.38 immediately following the results.
Amphastar Pharmaceuticals’s earnings report left more to be desired. Let’s look forward to see if this quarter has created an opportunity to buy the stock. If you’re making that decision, you should consider the bigger picture of valuation, business qualities, as well as the latest earnings. We cover that in our actionable full research report which you can read here (it’s free).