
Pediatric healthcare provider Pediatrix Medical Group (NYSE: MD) reported Q4 CY2025 results beating Wall Street’s revenue expectations, but sales fell by 1.7% year on year to $493.8 million. Its non-GAAP profit of $0.50 per share was 7.1% below analysts’ consensus estimates.
Is now the time to buy Pediatrix Medical Group? Find out by accessing our full research report, it’s free.
Pediatrix Medical Group (MD) Q4 CY2025 Highlights:
- Revenue: $493.8 million vs analyst estimates of $487.3 million (1.7% year-on-year decline, 1.3% beat)
- Adjusted EPS: $0.50 vs analyst expectations of $0.54 (7.1% miss)
- Adjusted EBITDA: $65.85 million vs analyst estimates of $69.65 million (13.3% margin, 5.5% miss)
- EBITDA guidance for the upcoming financial year 2026 is $290 million at the midpoint, above analyst estimates of $282.7 million
- Operating Margin: 9.9%, up from 7.8% in the same quarter last year
- Same-Store Sales rose 4% year on year (8.7% in the same quarter last year)
- Market Capitalization: $1.85 billion
“Our fourth quarter operating results were in line with our revised upward expectations and reflected solid same-unit revenue growth, partially offset by an increase in variable practice incentive compensation,” said Mark S. Ordan, Chief Executive Officer of Pediatrix Medical Group.
Company Overview
With a network of approximately 2,620 affiliated physicians caring for some of the most vulnerable patients, Pediatrix Medical Group (NYSE: MD) provides specialized physician services focused on neonatal, maternal-fetal, pediatric cardiology and other pediatric subspecialty care across 37 states.
Revenue Growth
A company’s long-term sales performance is one signal of its overall quality. Any business can experience short-term success, but top-performing ones enjoy sustained growth for years. Unfortunately, Pediatrix Medical Group’s 2% annualized revenue growth over the last five years was tepid. This was below our standards and is a tough starting point for our analysis.
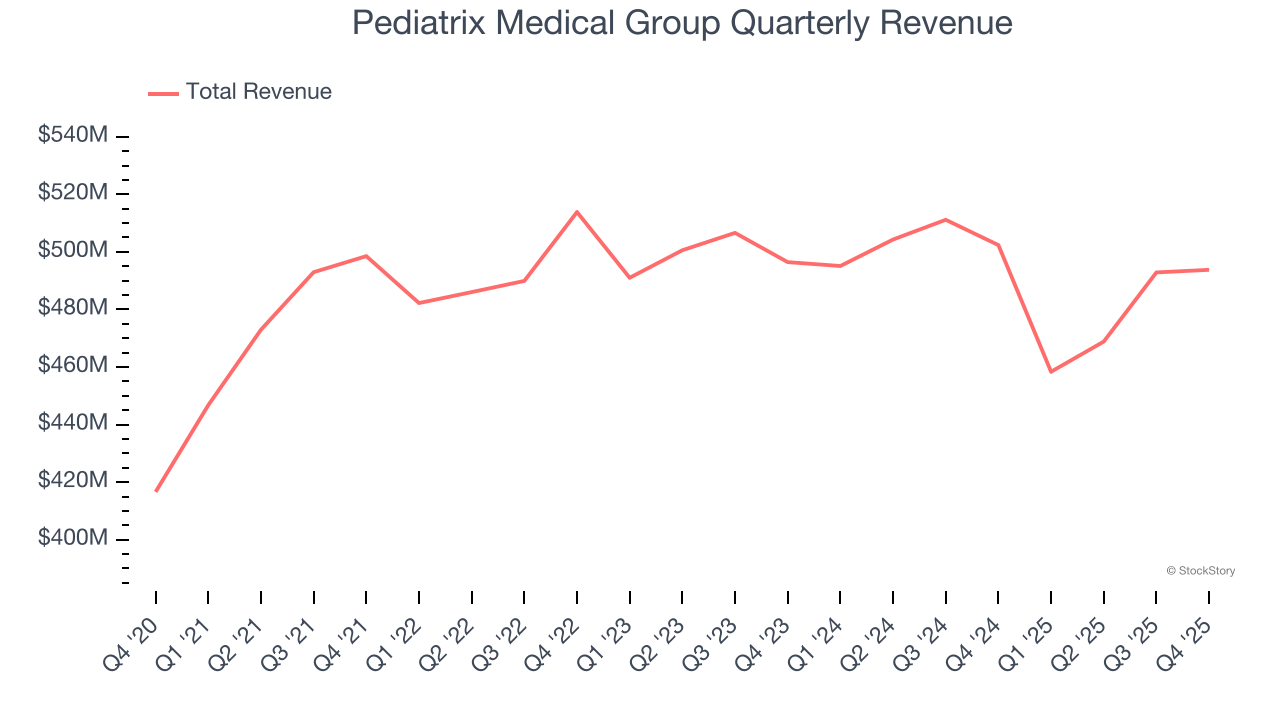
We at StockStory place the most emphasis on long-term growth, but within healthcare, a half-decade historical view may miss recent innovations or disruptive industry trends. Pediatrix Medical Group’s performance shows it grew in the past but relinquished its gains over the last two years, as its revenue fell by 2% annually. 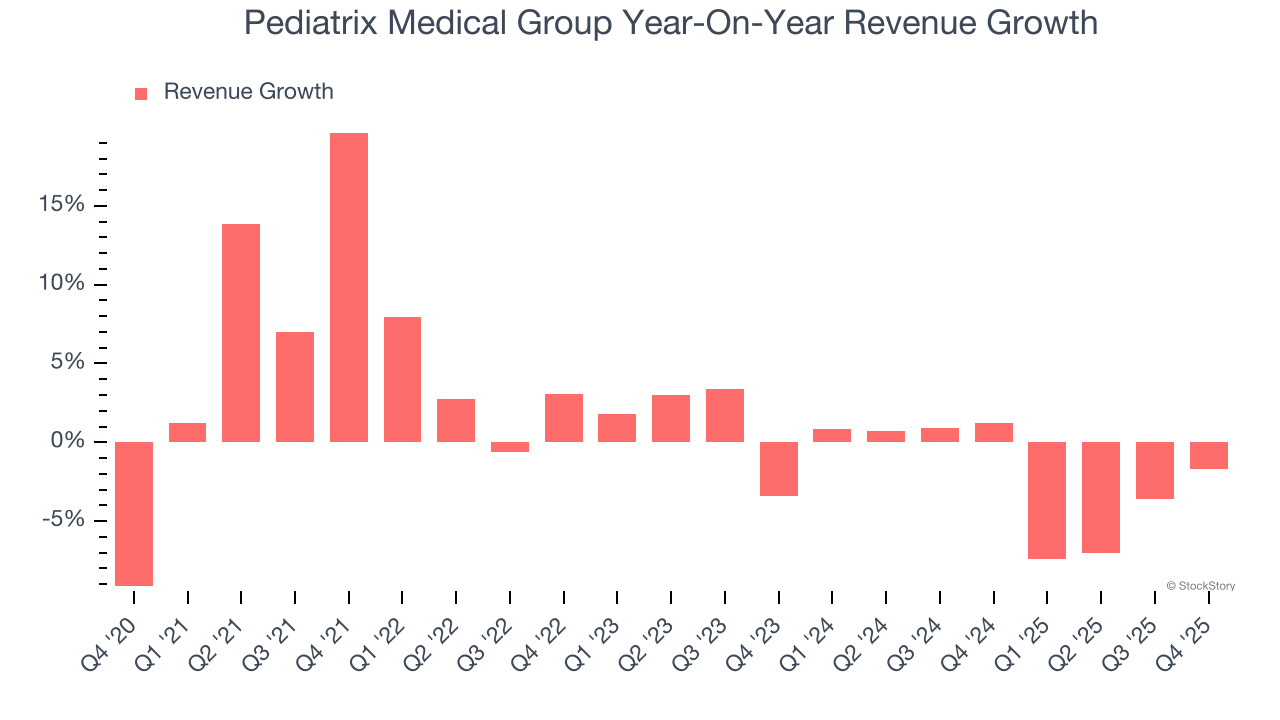
We can better understand the company’s revenue dynamics by analyzing its same-store sales, which show how much revenue its established locations generate. Over the last two years, Pediatrix Medical Group’s same-store sales averaged 5.5% year-on-year growth. Because this number is better than its revenue growth, we can see its sales from existing locations are performing better than its sales from new locations. 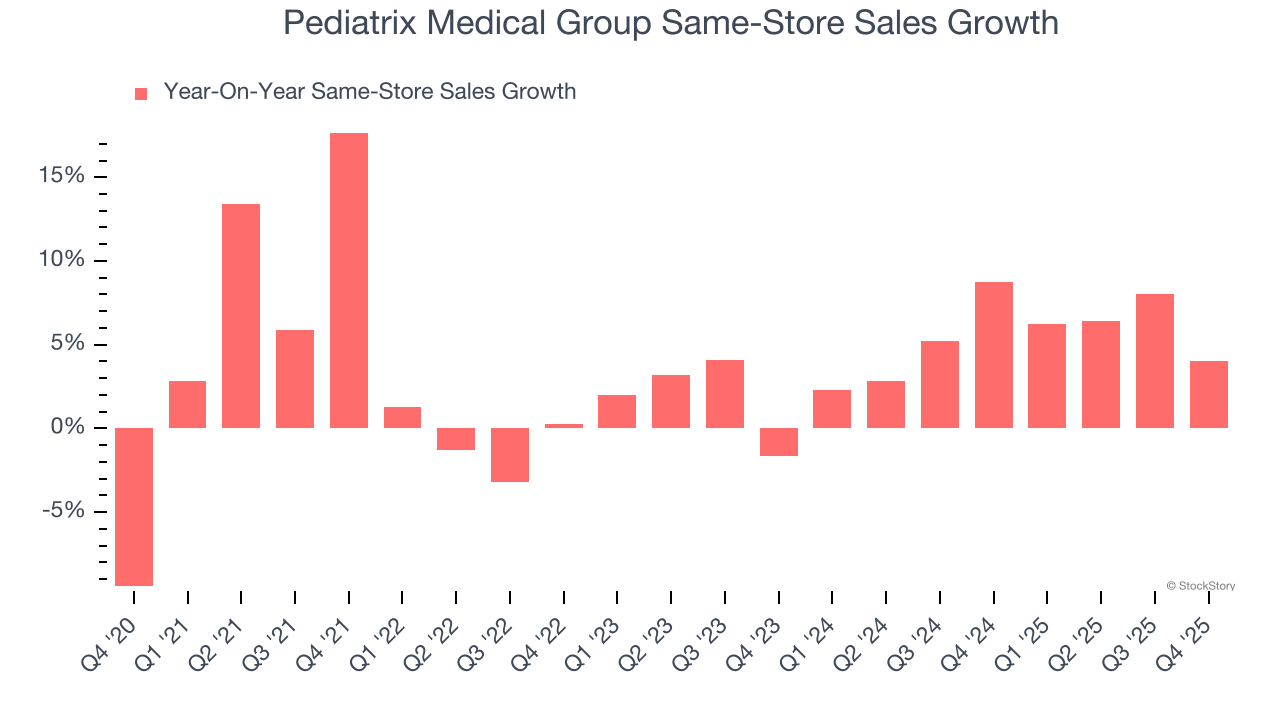
This quarter, Pediatrix Medical Group’s revenue fell by 1.7% year on year to $493.8 million but beat Wall Street’s estimates by 1.3%.
Looking ahead, sell-side analysts expect revenue to grow 2.2% over the next 12 months. Although this projection implies its newer products and services will spur better top-line performance, it is still below the sector average.
While Wall Street chases Nvidia at all-time highs, an under-the-radar semiconductor supplier is dominating a critical AI component these giants can’t build without. Click here to access our free report one of our favorites growth stories.
Operating Margin
Pediatrix Medical Group’s operating margin has risen over the last 12 months and averaged 5.3% over the last five years. The company’s higher efficiency is a breath of fresh air, but its suboptimal cost structure means it still sports paltry profitability for a healthcare business.
Looking at the trend in its profitability, Pediatrix Medical Group’s operating margin of 10.9% for the trailing 12 months may be around the same as five years ago, but it has increased by 10.5 percentage points over the last two years.
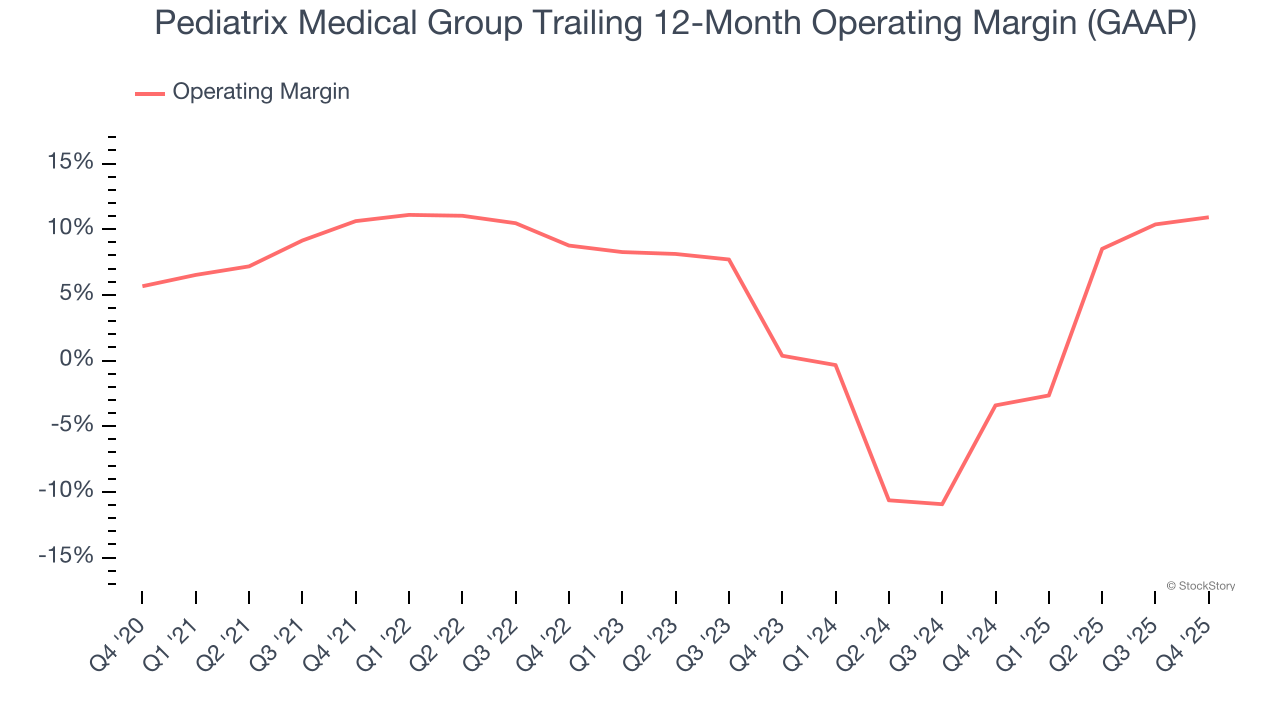
In Q4, Pediatrix Medical Group generated an operating margin profit margin of 9.9%, up 2.1 percentage points year on year. This increase was a welcome development, especially since its revenue fell, showing it was more efficient because it scaled down its expenses.
Earnings Per Share
Revenue trends explain a company’s historical growth, but the long-term change in earnings per share (EPS) points to the profitability of that growth – for example, a company could inflate its sales through excessive spending on advertising and promotions.
Pediatrix Medical Group’s EPS grew at a remarkable 10% compounded annual growth rate over the last five years, higher than its 2% annualized revenue growth. This tells us the company became more profitable on a per-share basis as it expanded.
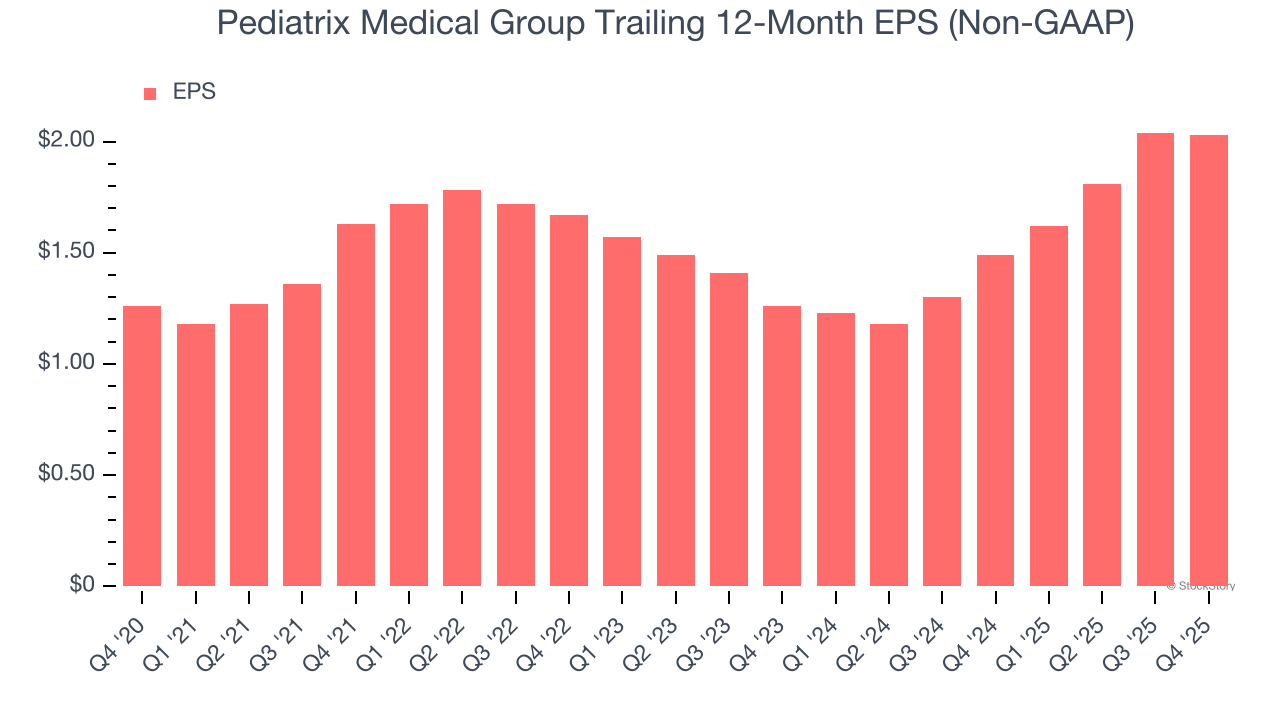
In Q4, Pediatrix Medical Group reported adjusted EPS of $0.50, down from $0.51 in the same quarter last year. This print missed analysts’ estimates, but we care more about long-term adjusted EPS growth than short-term movements. Over the next 12 months, Wall Street expects Pediatrix Medical Group’s full-year EPS of $2.03 to grow 8.8%.
Key Takeaways from Pediatrix Medical Group’s Q4 Results
It was good to see Pediatrix Medical Group narrowly top analysts’ revenue expectations this quarter. We were also glad its full-year EBITDA guidance exceeded Wall Street’s estimates. On the other hand, its EPS missed. Overall, this quarter was mixed. The stock traded up 2.1% to $22.44 immediately after reporting.
Is Pediatrix Medical Group an attractive investment opportunity right now? The latest quarter does matter, but not nearly as much as longer-term fundamentals and valuation, when deciding if the stock is a buy. We cover that in our actionable full research report which you can read here (it’s free).


