
Membership-only discount retailer BJ’s Wholesale Club (NYSE: BJ) missed Wall Street’s revenue expectations in Q1 CY2025 as sales rose 4.8% year on year to $5.15 billion. Its non-GAAP profit of $1.14 per share was 25.1% above analysts’ consensus estimates.
Is now the time to buy BJ's? Find out by accessing our full research report, it’s free.
BJ's (BJ) Q1 CY2025 Highlights:
- Revenue: $5.15 billion vs analyst estimates of $5.18 billion (4.8% year-on-year growth, 0.6% miss)
- Adjusted EPS: $1.14 vs analyst estimates of $0.91 (25.1% beat)
- Adjusted EBITDA: $285.8 million vs analyst estimates of $258.4 million (5.5% margin, 10.6% beat)
- Management reiterated its full-year Adjusted EPS guidance of $4.20 at the midpoint
- Operating Margin: 4%, in line with the same quarter last year
- Free Cash Flow Margin: 1.3%, similar to the same quarter last year
- Locations: 255 at quarter end, up from 244 in the same quarter last year
- Same-Store Sales rose 1.6% year on year, in line with the same quarter last year
- Market Capitalization: $15.47 billion
Company Overview
Appealing to the budget-conscious individual shopping for a household, BJ’s Wholesale Club (NYSE: BJ) is a membership-only retail chain that sells groceries, appliances, electronics, and household items, often in bulk quantities.
Sales Growth
A company’s long-term sales performance can indicate its overall quality. Even a bad business can shine for one or two quarters, but a top-tier one grows for years.
With $20.74 billion in revenue over the past 12 months, BJ's is one of the larger companies in the consumer retail industry and benefits from a well-known brand that influences purchasing decisions. However, its scale is a double-edged sword because there is only so much real estate to build new stores, placing a ceiling on its growth. To accelerate sales, BJ's likely needs to optimize its pricing or lean into international expansion.
As you can see below, BJ’s sales grew at a mediocre 8% compounded annual growth rate over the last six years (we compare to 2019 to normalize for COVID-19 impacts) as it barely increased sales at existing, established locations.
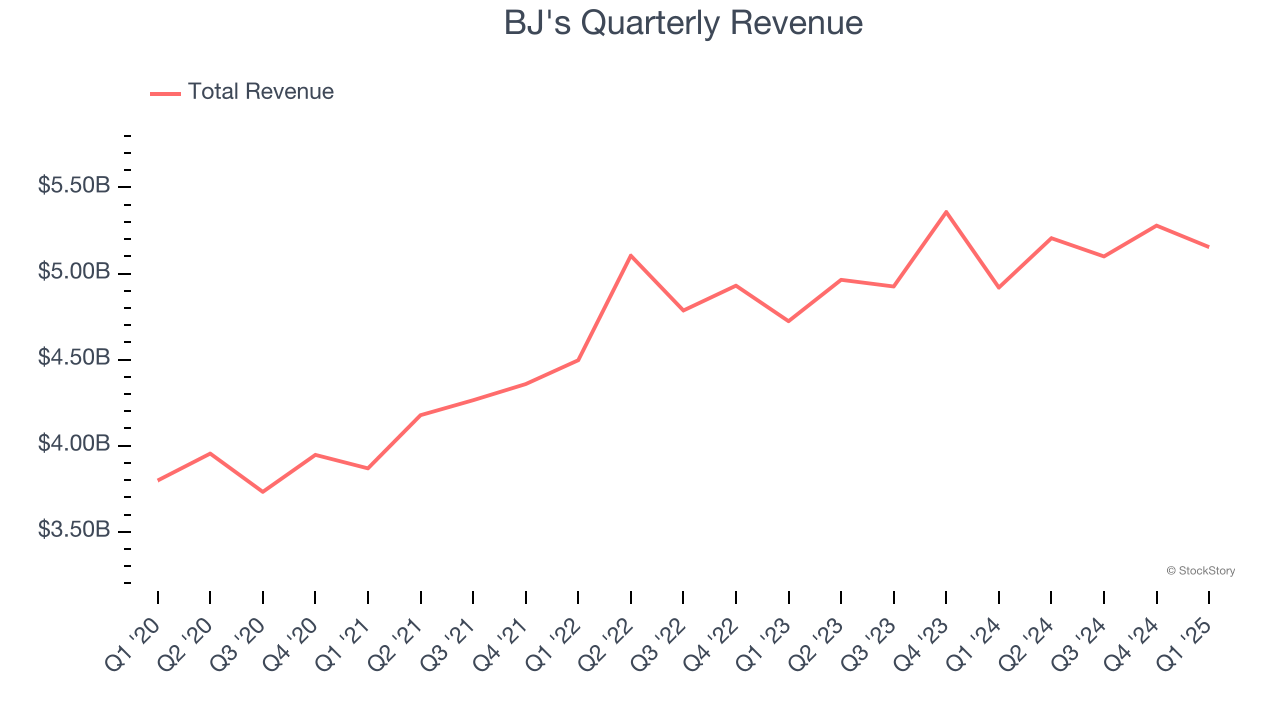
This quarter, BJ’s revenue grew by 4.8% year on year to $5.15 billion, falling short of Wall Street’s estimates.
Looking ahead, sell-side analysts expect revenue to grow 6.5% over the next 12 months, similar to its six-year rate. We still think its growth trajectory is attractive given its scale and implies the market is baking in success for its products.
Unless you’ve been living under a rock, it should be obvious by now that generative AI is going to have a huge impact on how large corporations do business. While Nvidia and AMD are trading close to all-time highs, we prefer a lesser-known (but still profitable) stock benefiting from the rise of AI. Click here to access our free report one of our favorites growth stories.
Store Performance
Number of Stores
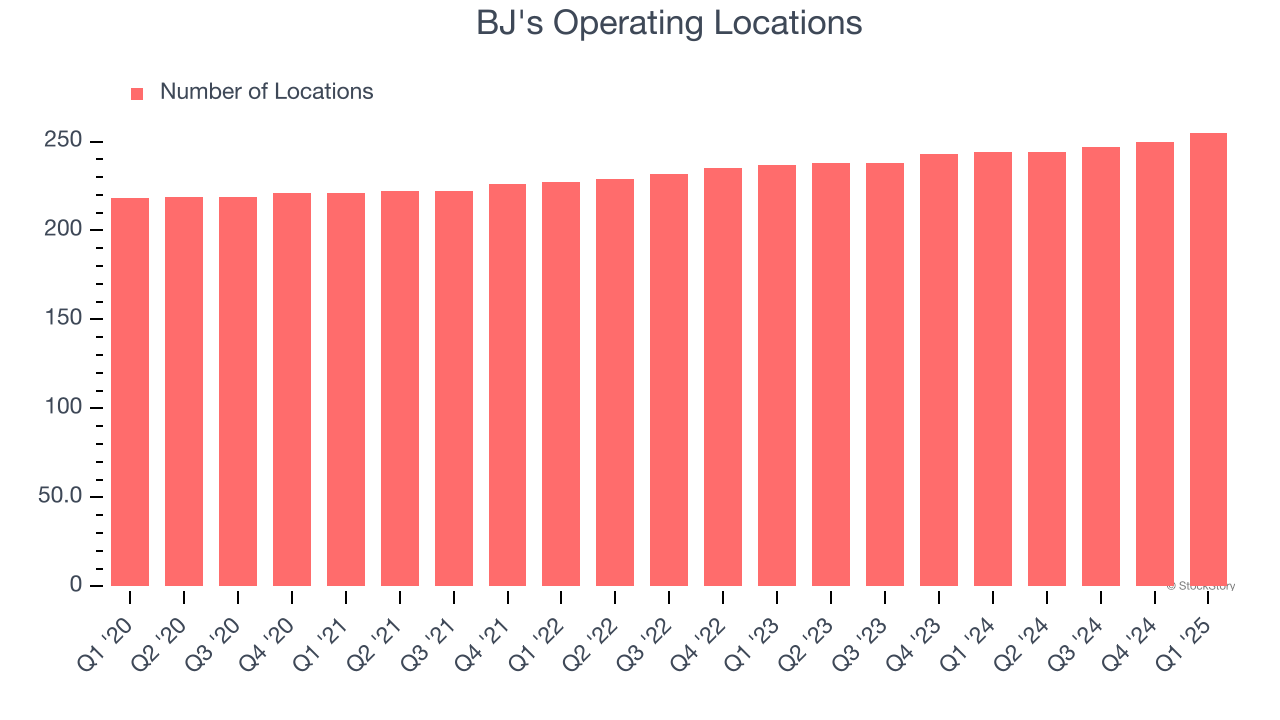
A retailer’s store count influences how much it can sell and how quickly revenue can grow.
BJ's operated 255 locations in the latest quarter. It has opened new stores quickly over the last two years, averaging 3.3% annual growth, faster than the broader consumer retail sector.
When a retailer opens new stores, it usually means it’s investing for growth because demand is greater than supply, especially in areas where consumers may not have a store within reasonable driving distance.
Same-Store Sales
A company's store base only paints one part of the picture. When demand is high, it makes sense to open more. But when demand is low, it’s prudent to close some locations and use the money in other ways. Same-store sales gives us insight into this topic because it measures organic growth for a retailer's e-commerce platform and brick-and-mortar shops that have existed for at least a year.
BJ’s demand within its existing locations has been relatively stable over the last two years but was below most retailers. On average, the company’s same-store sales have grown by 1.7% per year. This performance suggests it should consider improving its foot traffic and efficiency before expanding its store base.
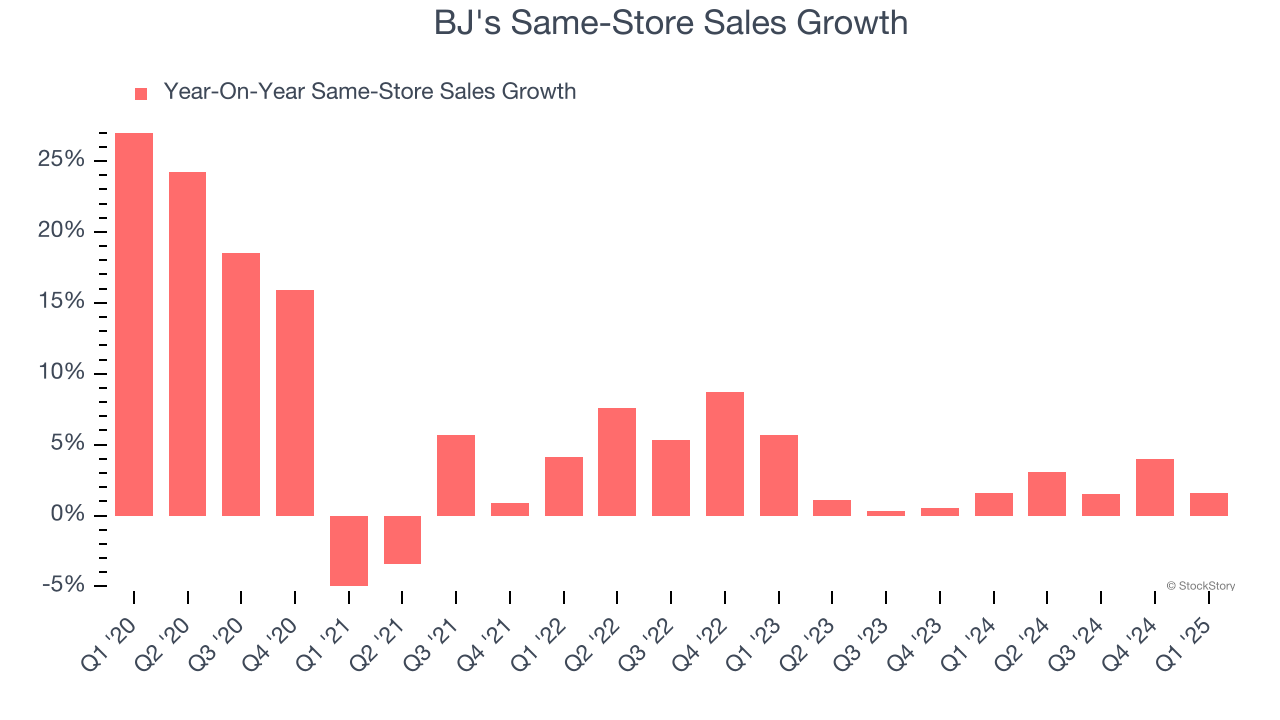
In the latest quarter, BJ’s same-store sales rose 1.6% year on year. This performance was more or less in line with its historical levels.
Key Takeaways from BJ’s Q1 Results
We were impressed by how significantly BJ's blew past analysts’ EBITDA expectations this quarter. We were also glad its EPS outperformed Wall Street’s estimates. On the other hand, its full-year EPS guidance slightly missed and its revenue fell slightly short of Wall Street’s estimates. Overall, we think this was still a mixed quarter. The stock remained flat at $117.50 immediately following the results.
BJ's put up rock-solid earnings, but one quarter doesn’t necessarily make the stock a buy. Let’s see if this is a good investment. We think that the latest quarter is only one piece of the longer-term business quality puzzle. Quality, when combined with valuation, can help determine if the stock is a buy. We cover that in our actionable full research report which you can read here, it’s free.


