
Aerospace and defense company Kratos (NASDAQ: KTOS) reported revenue ahead of Wall Streets expectations in Q3 CY2025, with sales up 26% year on year to $347.6 million. Revenue guidance for the full year exceeded analysts’ estimates, but next quarter’s guidance of $325 million was less impressive, coming in 2.5% below expectations. Its non-GAAP profit of $0.14 per share was 17.5% above analysts’ consensus estimates.
Is now the time to buy Kratos? Find out by accessing our full research report, it’s free for active Edge members.
Kratos (KTOS) Q3 CY2025 Highlights:
- Revenue: $347.6 million vs analyst estimates of $320.8 million (26% year-on-year growth, 8.3% beat)
- Adjusted EPS: $0.14 vs analyst estimates of $0.12 (17.5% beat)
- Adjusted EBITDA: $30.8 million vs analyst estimates of $28.43 million (8.9% margin, 8.3% beat)
- Revenue Guidance for Q4 CY2025 is $325 million at the midpoint, below analyst estimates of $333.3 million
- EBITDA guidance for the full year is $35.5 million at the midpoint, below analyst estimates of $118.5 million
- Operating Margin: 2%, in line with the same quarter last year
- Free Cash Flow was -$41.3 million compared to -$9.2 million in the same quarter last year
- Organic Revenue rose 23.7% year on year vs analyst estimates of 14.9% growth (880.7 basis point beat)
- Market Capitalization: $15.38 billion
Eric DeMarco, Kratos’ President and CEO, said, “Our Q3 financial results are representative of the increasing demand for Kratos’ military grade hardware, systems and software to support U.S. National Security and its allies. Also reflective of this demand, we are once again increasing our full year 2025 revenue guidance, and we are increasing our full year 2026 organic revenue growth forecast up to 15 percent to 20 percent above our expected increased annual 2025 revenue. Additionally, we are providing a preliminary 2027 organic revenue growth target of 18 percent to 23 percent above this increased 2026 estimated revenue range. We are also expecting EBITDA margin expansion for both 2026 and 2027, as we scale the business and transition to more profitable contracts, with EBITDA margins expected to increase even as we continue to make significant bid, proposal and other new opportunity related investments as we have in 2025, as we pursue multiple large new program opportunities.”
Company Overview
Established with a commitment to supporting national security, Kratos (NASDAQ: KTOS) is a provider of advanced engineering, technology, and security solutions tailored for critical national security applications.
Revenue Growth
A company’s long-term sales performance is one signal of its overall quality. Any business can experience short-term success, but top-performing ones enjoy sustained growth for years. Over the last five years, Kratos grew its sales at an excellent 12.1% compounded annual growth rate. Its growth beat the average industrials company and shows its offerings resonate with customers.
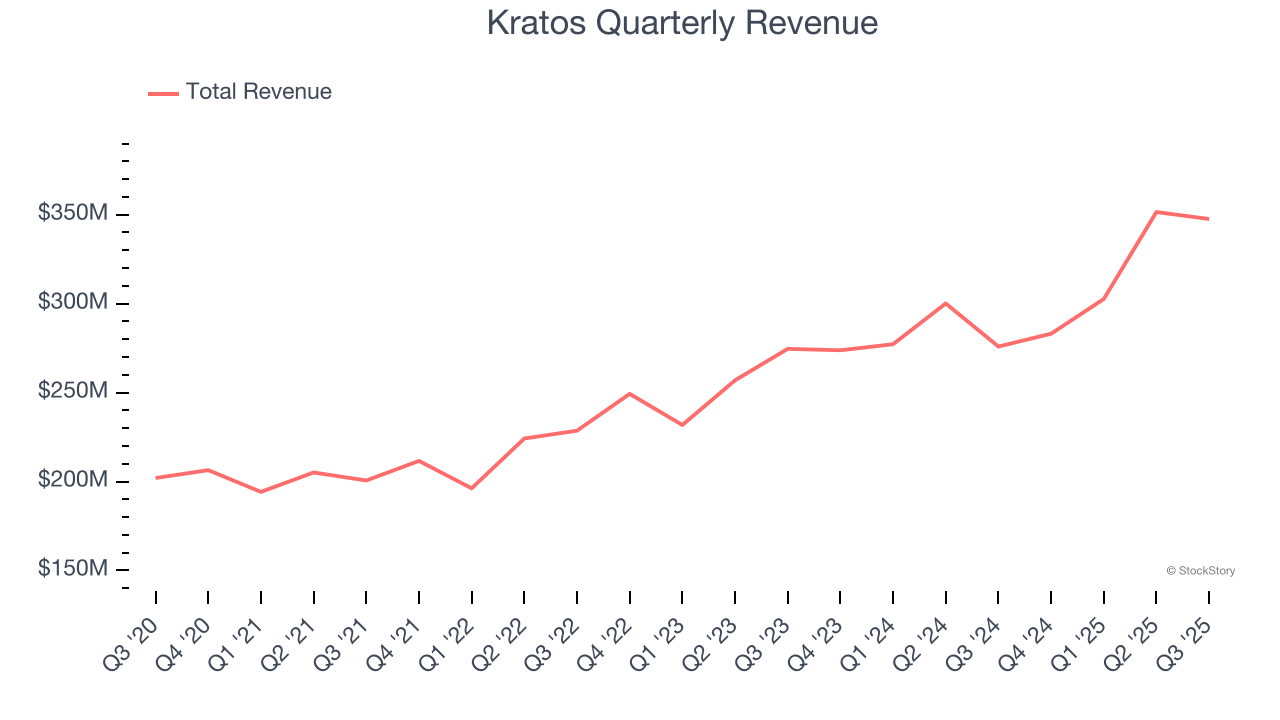
Long-term growth is the most important, but within industrials, a half-decade historical view may miss new industry trends or demand cycles. Kratos’s annualized revenue growth of 12.6% over the last two years aligns with its five-year trend, suggesting its demand was predictably strong. 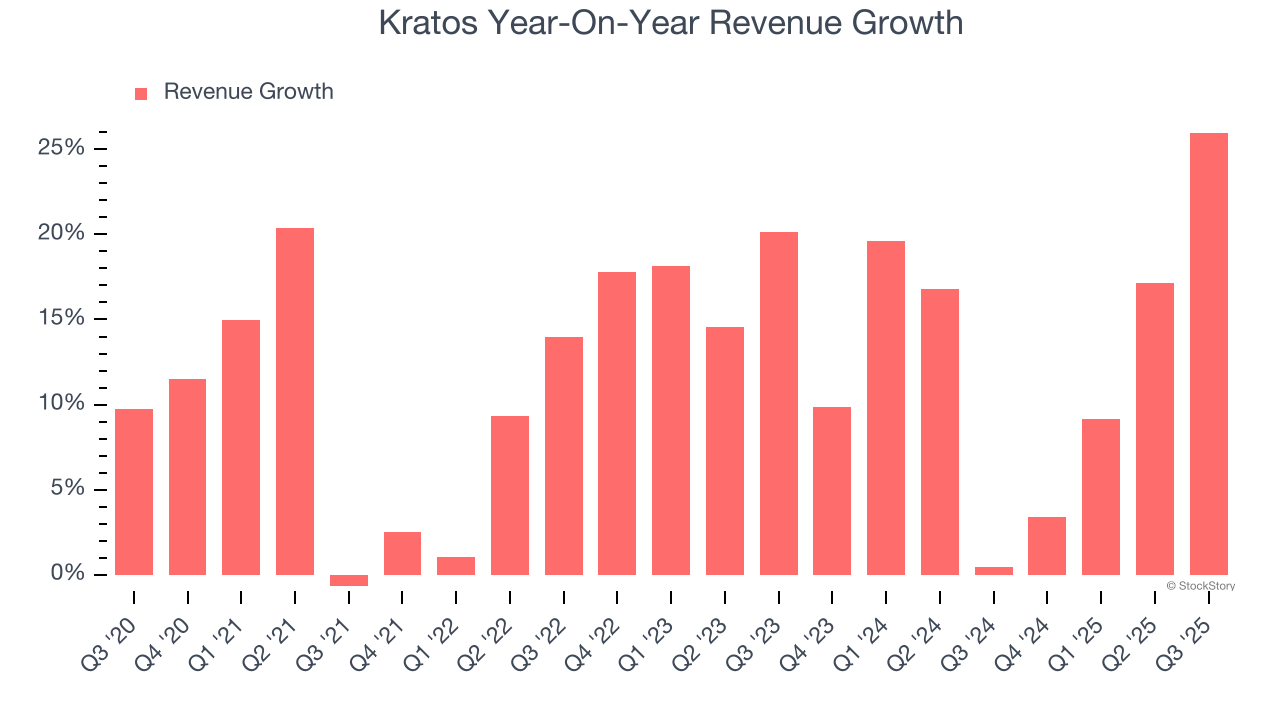
Kratos also reports organic revenue, which strips out one-time events like acquisitions and currency fluctuations that don’t accurately reflect its fundamentals. Over the last two years, Kratos’s organic revenue averaged 11.6% year-on-year growth. Because this number aligns with its two-year revenue growth, we can see the company’s core operations (not acquisitions and divestitures) drove most of its results. 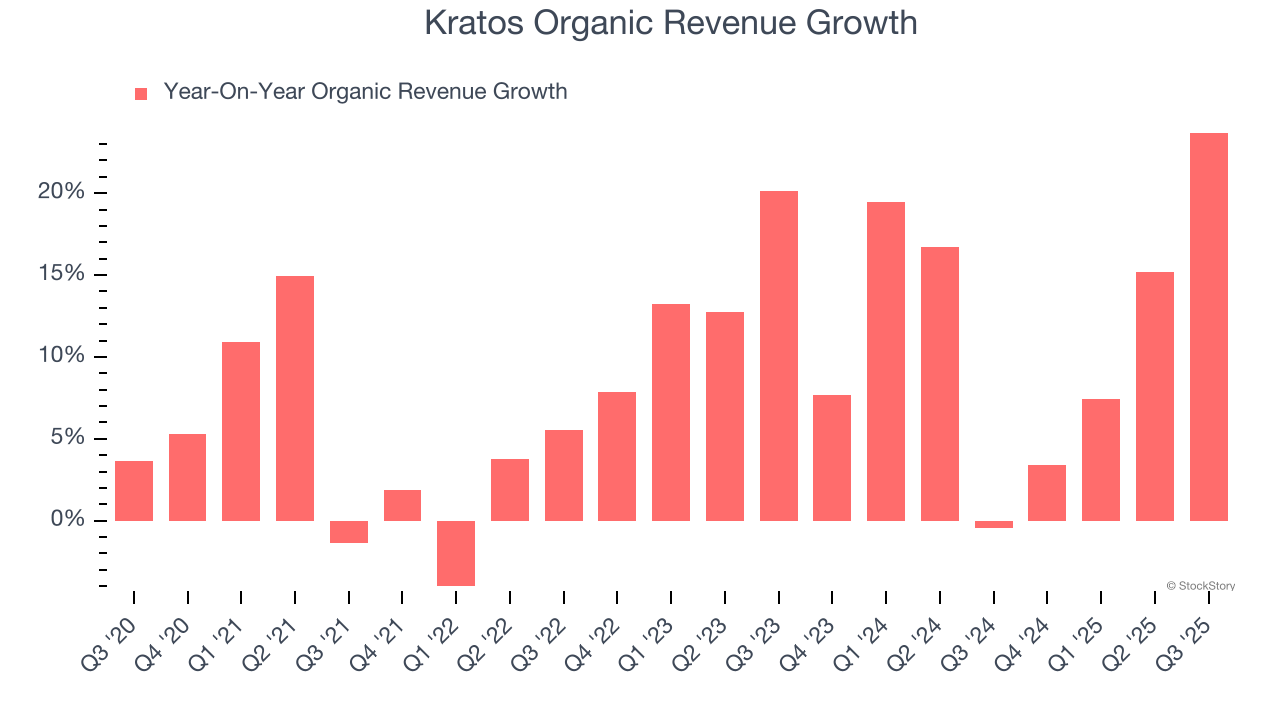
This quarter, Kratos reported robust year-on-year revenue growth of 26%, and its $347.6 million of revenue topped Wall Street estimates by 8.3%. Company management is currently guiding for a 14.8% year-on-year increase in sales next quarter.
Looking further ahead, sell-side analysts expect revenue to grow 14.4% over the next 12 months, an improvement versus the last two years. This projection is admirable and suggests its newer products and services will spur better top-line performance.
While Wall Street chases Nvidia at all-time highs, an under-the-radar semiconductor supplier is dominating a critical AI component these giants can’t build without. Click here to access our free report one of our favorites growth stories.
Operating Margin
Operating margin is an important measure of profitability as it shows the portion of revenue left after accounting for all core expenses – everything from the cost of goods sold to advertising and wages. It’s also useful for comparing profitability across companies with different levels of debt and tax rates because it excludes interest and taxes.
Kratos was profitable over the last five years but held back by its large cost base. Its average operating margin of 2.2% was weak for an industrials business.
Looking at the trend in its profitability, Kratos’s operating margin decreased by 1.8 percentage points over the last five years. This raises questions about the company’s expense base because its revenue growth should have given it leverage on its fixed costs, resulting in better economies of scale and profitability. Kratos’s performance was poor no matter how you look at it - it shows that costs were rising and it couldn’t pass them onto its customers.
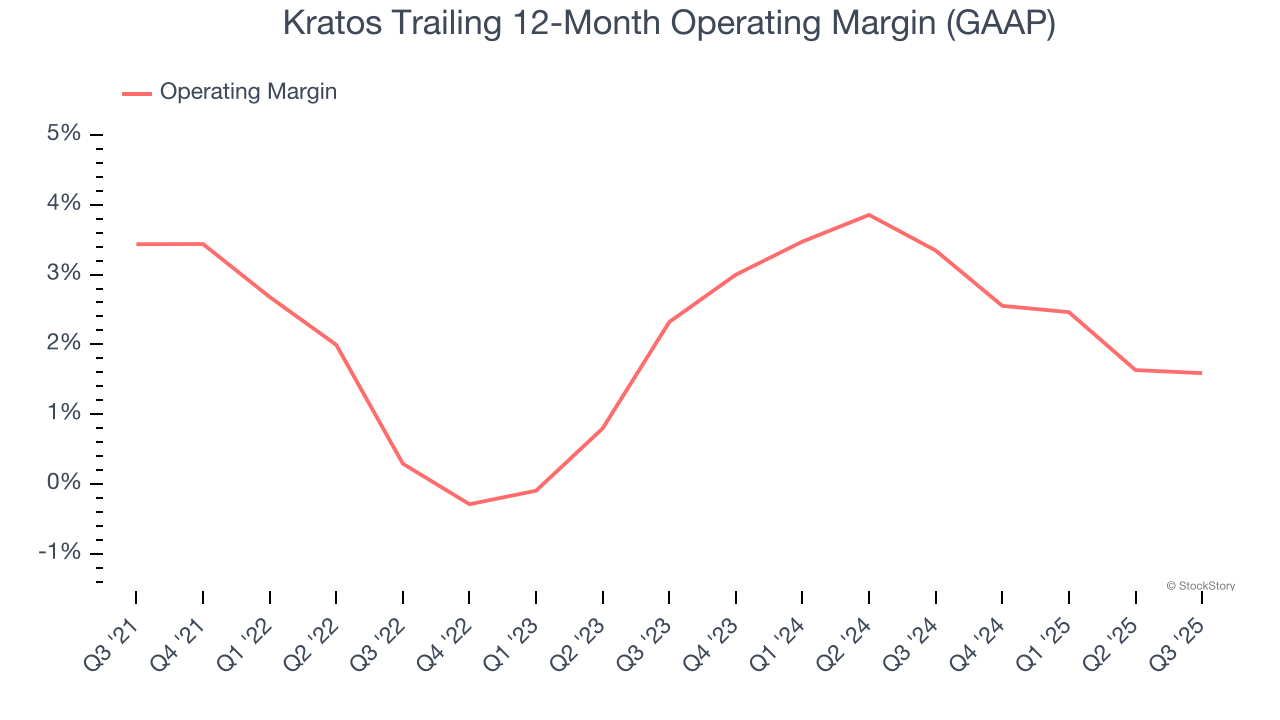
This quarter, Kratos generated an operating margin profit margin of 2%, in line with the same quarter last year. This indicates the company’s overall cost structure has been relatively stable.
Earnings Per Share
Revenue trends explain a company’s historical growth, but the long-term change in earnings per share (EPS) points to the profitability of that growth – for example, a company could inflate its sales through excessive spending on advertising and promotions.
Kratos’s EPS grew at an unimpressive 4.2% compounded annual growth rate over the last five years, lower than its 12.1% annualized revenue growth. This tells us the company became less profitable on a per-share basis as it expanded.
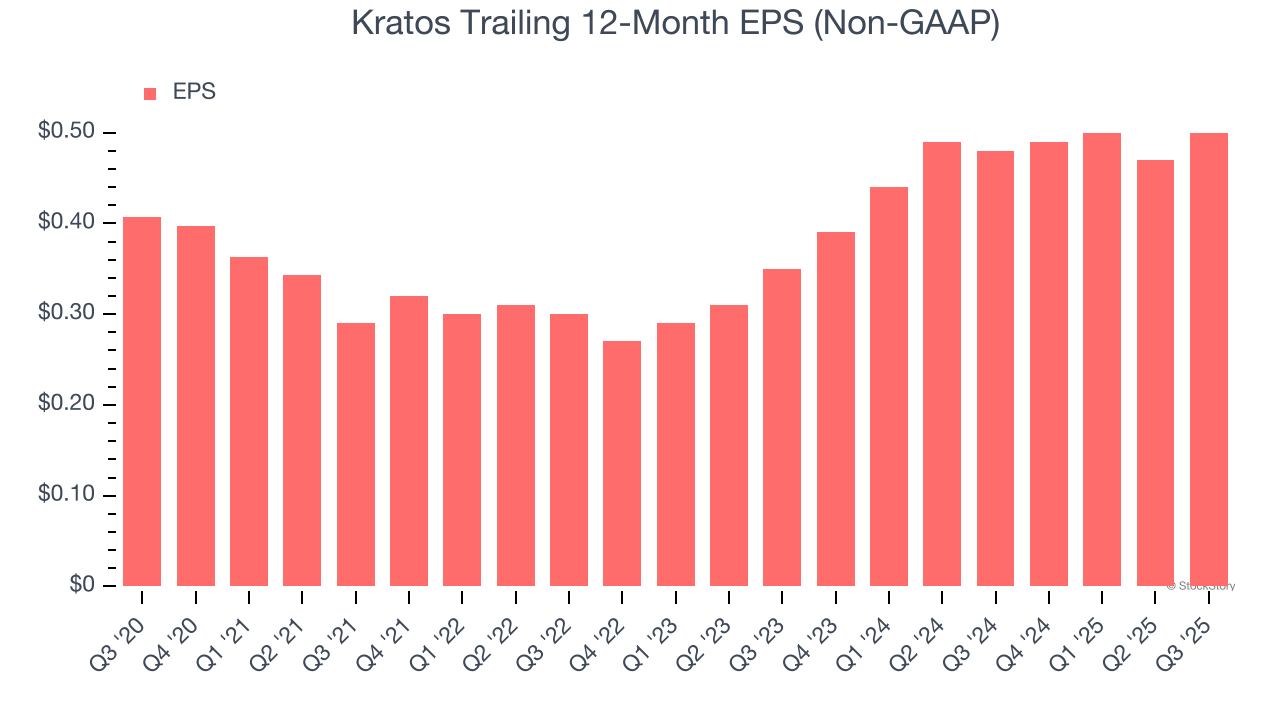
We can take a deeper look into Kratos’s earnings to better understand the drivers of its performance. As we mentioned earlier, Kratos’s operating margin was flat this quarter but declined by 1.8 percentage points over the last five years. Its share count also grew by 36.8%, meaning the company not only became less efficient with its operating expenses but also diluted its shareholders. 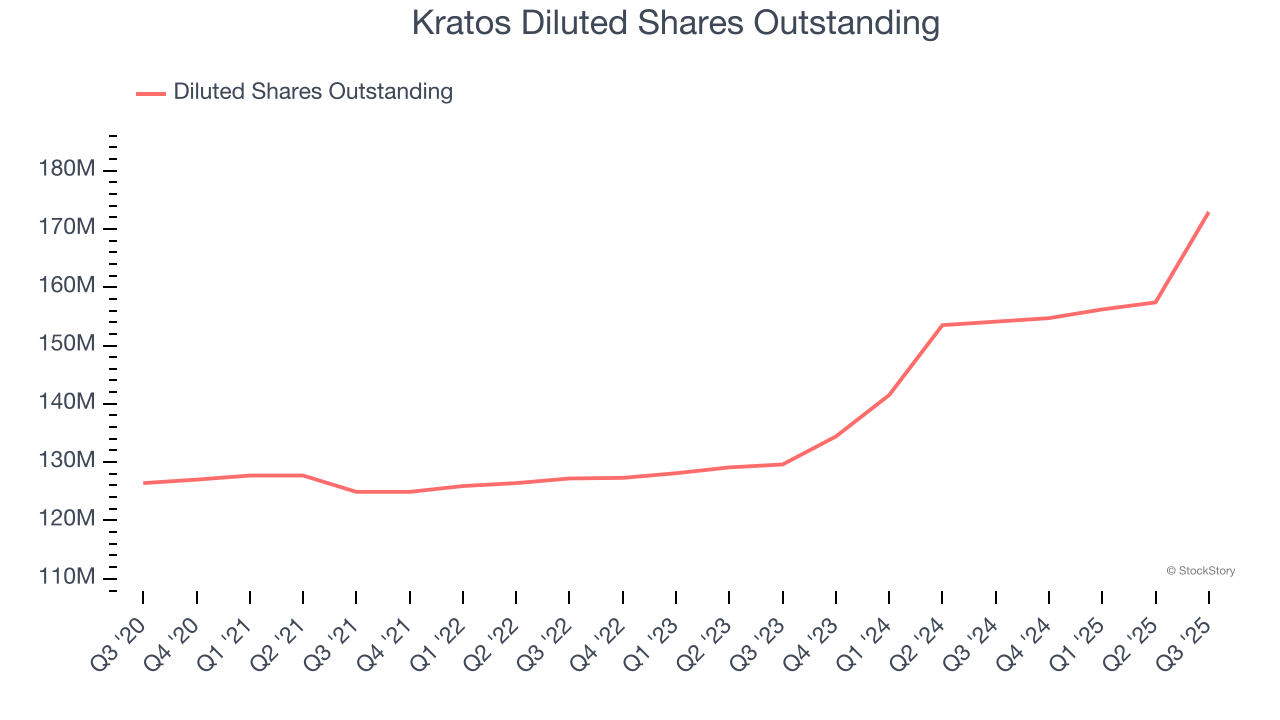
Like with revenue, we analyze EPS over a shorter period to see if we are missing a change in the business.
For Kratos, its two-year annual EPS growth of 19.5% was higher than its five-year trend. This acceleration made it one of the faster-growing industrials companies in recent history.
In Q3, Kratos reported adjusted EPS of $0.14, up from $0.11 in the same quarter last year. This print easily cleared analysts’ estimates, and shareholders should be content with the results. Over the next 12 months, Wall Street expects Kratos’s full-year EPS of $0.50 to grow 44.2%.
Key Takeaways from Kratos’s Q3 Results
We were impressed by how significantly Kratos blew past analysts’ organic revenue and EBITDA expectations this quarter. On the other hand, its revenue and EBITDA guidance for next quarter fell short of Wall Street’s estimates. Overall, we think this was a mixed quarter. The market seemed to be hoping for a stronger outlook, and the stock traded down 6.9% to $84 immediately following the results.
Is Kratos an attractive investment opportunity right now? The latest quarter does matter, but not nearly as much as longer-term fundamentals and valuation, when deciding if the stock is a buy. We cover that in our actionable full research report which you can read here, it’s free for active Edge members.


