
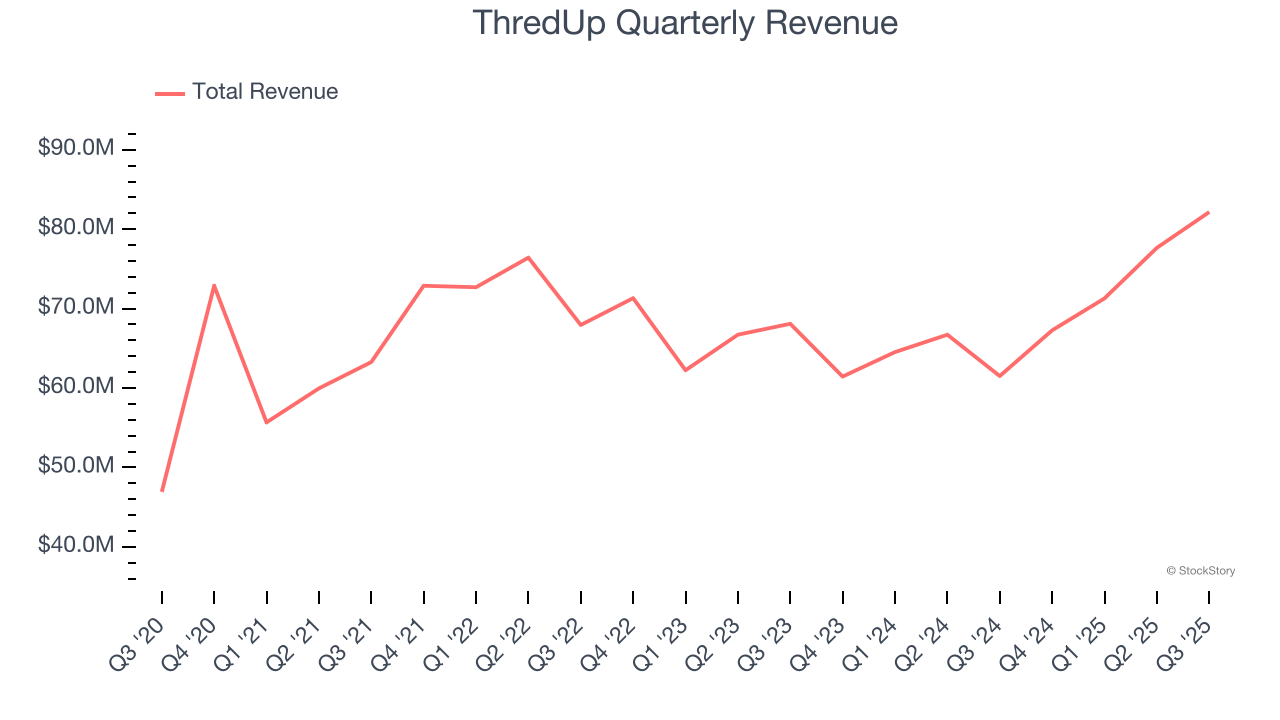
Online fashion resale marketplace ThredUp (NASDAQ: TDUP) announced better-than-expected revenue in Q3 CY2025, with sales up 33.6% year on year to $82.16 million. On top of that, next quarter’s revenue guidance ($77 million at the midpoint) was surprisingly good and 3.2% above what analysts were expecting. Its GAAP loss of $0.03 per share was $0.01 above analysts’ consensus estimates.
Is now the time to buy ThredUp? Find out by accessing our full research report, it’s free for active Edge members.
ThredUp (TDUP) Q3 CY2025 Highlights:
- Revenue: $82.16 million vs analyst estimates of $77.61 million (33.6% year-on-year growth, 5.9% beat)
- EPS (GAAP): -$0.03 vs analyst estimates of -$0.04 ($0.01 beat)
- Adjusted EBITDA: $3.77 million vs analyst estimates of $3.5 million (4.6% margin, relatively in line)
- Revenue Guidance for Q4 CY2025 is $77 million at the midpoint, above analyst estimates of $74.59 million
- Operating Margin: -5.3%, up from -17% in the same quarter last year
- Free Cash Flow Margin: 2.9%, similar to the same quarter last year
- Orders: 1.57 million, up 398,000 year on year
- Market Capitalization: $1.08 billion
“In Q3, we are proud to have delivered our fourth consecutive quarter of accelerating revenue growth, driven by exceptional new buyer acquisition and order growth,” said ThredUp CEO and co-founder James Reinhart.
Company Overview
Founded to revolutionize thrifting, ThredUp (NASDAQ: TDUP) is a leading online fashion resale marketplace offering a wide selection of gently-used clothing and accessories.
Revenue Growth
A company’s long-term performance is an indicator of its overall quality. Any business can put up a good quarter or two, but many enduring ones grow for years. Over the last five years, ThredUp grew its sales at a tepid 9.8% compounded annual growth rate. This fell short of our benchmark for the consumer discretionary sector and is a poor baseline for our analysis.
We at StockStory place the most emphasis on long-term growth, but within consumer discretionary, a stretched historical view may miss a company riding a successful new product or trend. ThredUp’s recent performance shows its demand has slowed as its annualized revenue growth of 5.4% over the last two years was below its five-year trend. 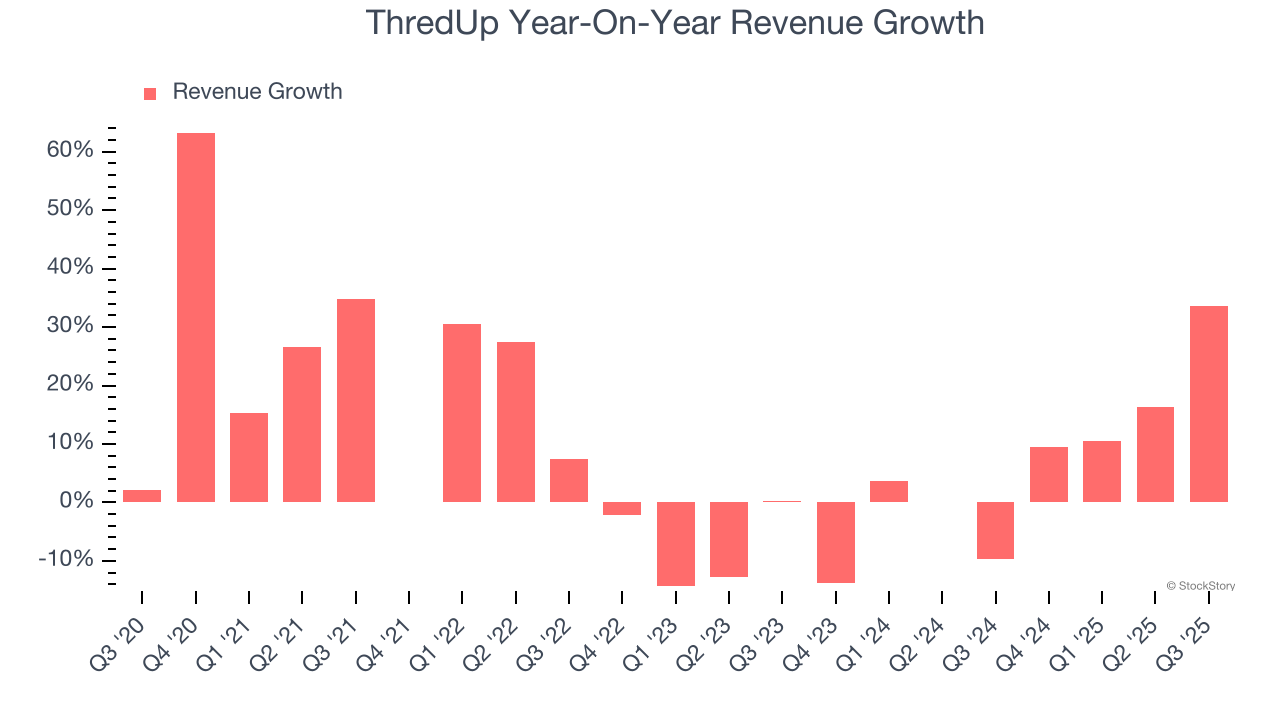
We can better understand the company’s revenue dynamics by analyzing its number of orders, which reached 1.57 million in the latest quarter. Over the last two years, ThredUp’s orders averaged 6% year-on-year growth. Because this number aligns with its revenue growth during the same period, we can see the company’s monetization was fairly consistent. 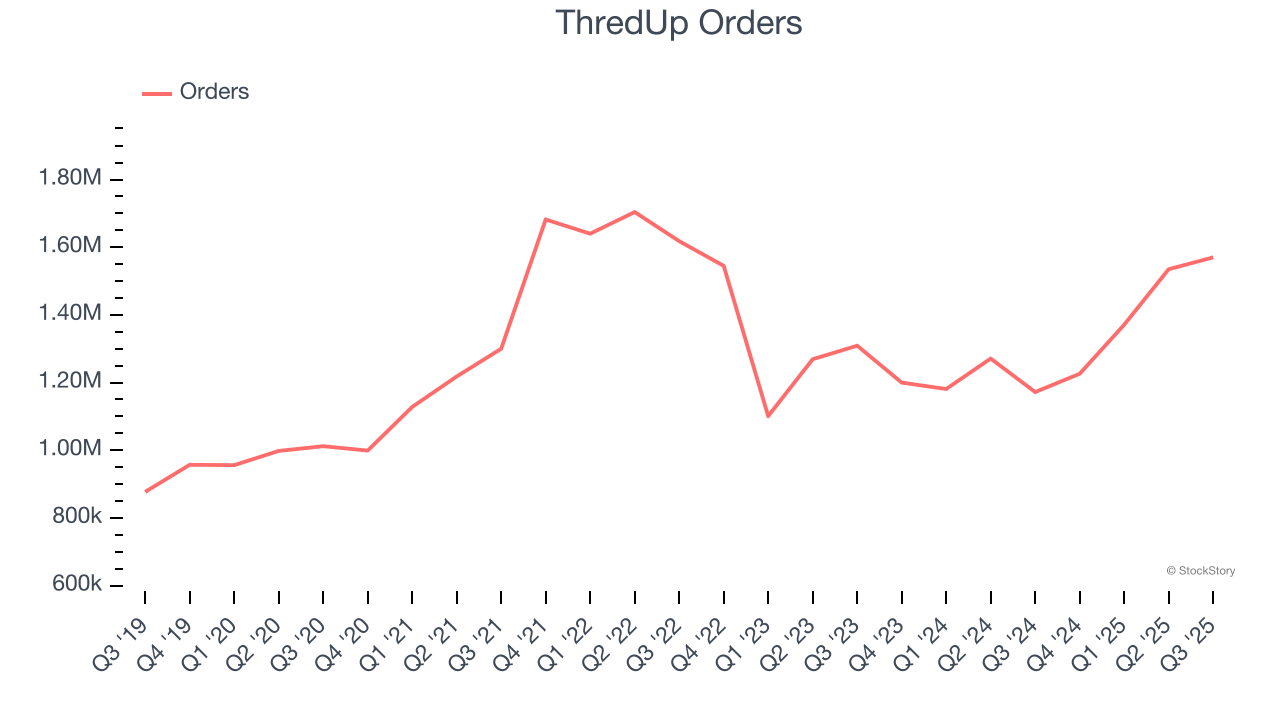
This quarter, ThredUp reported wonderful year-on-year revenue growth of 33.6%, and its $82.16 million of revenue exceeded Wall Street’s estimates by 5.9%. Company management is currently guiding for a 14.5% year-on-year increase in sales next quarter.
Looking further ahead, sell-side analysts expect revenue to grow 8.6% over the next 12 months. Although this projection suggests its newer products and services will catalyze better top-line performance, it is still below average for the sector.
While Wall Street chases Nvidia at all-time highs, an under-the-radar semiconductor supplier is dominating a critical AI component these giants can’t build without. Click here to access our free report one of our favorites growth stories.
Operating Margin
ThredUp’s operating margin has risen over the last 12 months, but it still averaged negative 11.6% over the last two years. This is due to its large expense base and inefficient cost structure.
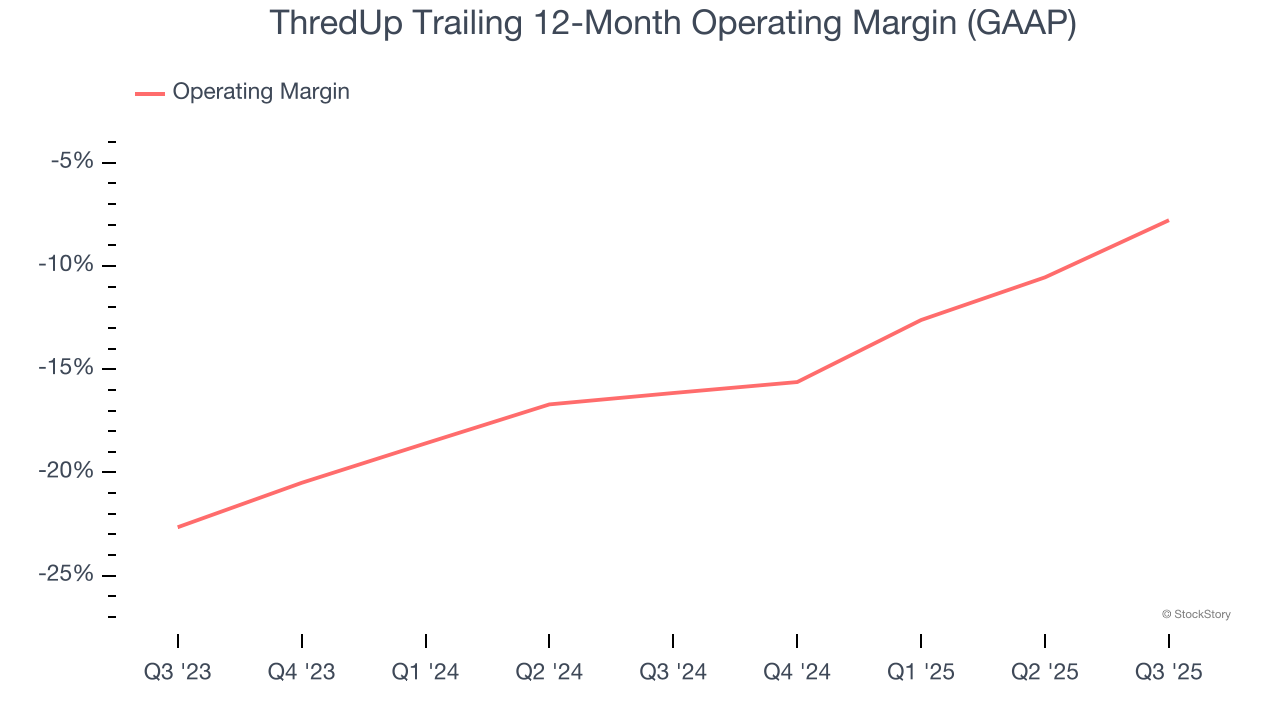
ThredUp’s operating margin was negative 5.3% this quarter. The company's consistent lack of profits raise a flag.
Earnings Per Share
We track the long-term change in earnings per share (EPS) for the same reason as long-term revenue growth. Compared to revenue, however, EPS highlights whether a company’s growth is profitable.
Although ThredUp’s full-year earnings are still negative, it reduced its losses and improved its EPS by 41.3% annually over the last five years. The next few quarters will be critical for assessing its long-term profitability.
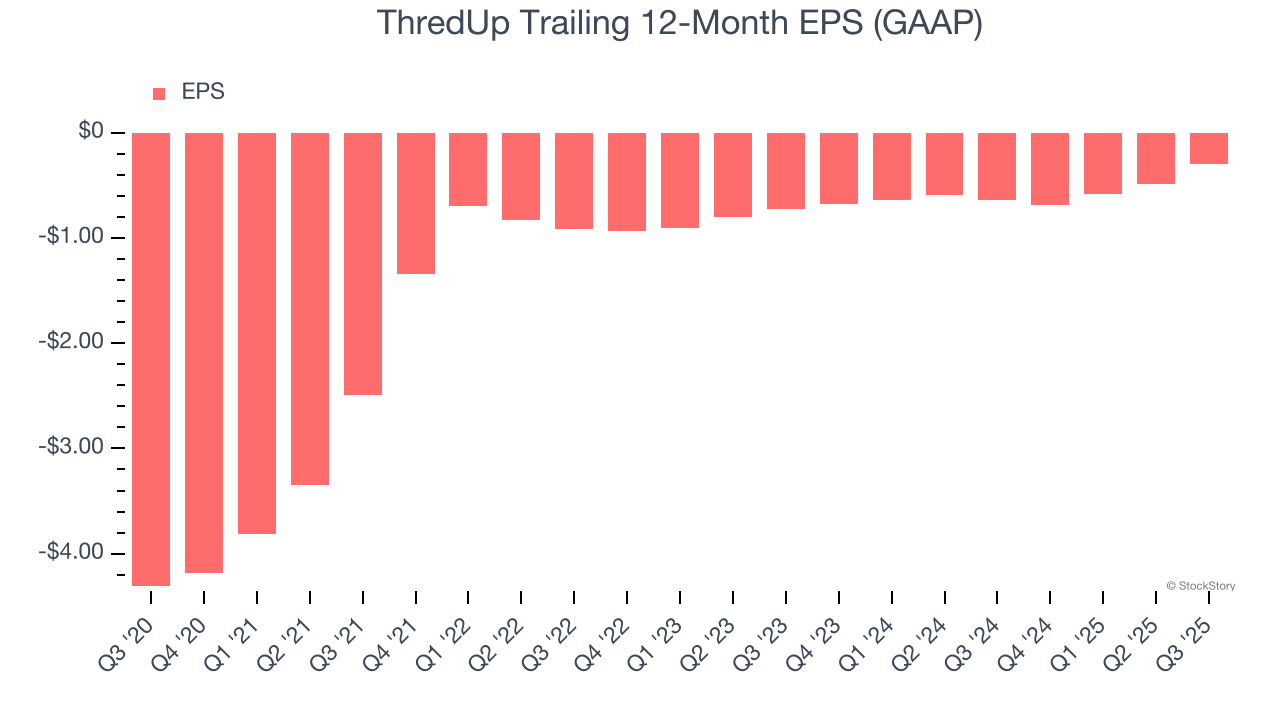
In Q3, ThredUp reported EPS of negative $0.03, up from negative $0.22 in the same quarter last year. This print easily cleared analysts’ estimates, and shareholders should be content with the results. Over the next 12 months, Wall Street expects ThredUp to improve its earnings losses. Analysts forecast its full-year EPS of negative $0.30 will advance to negative $0.10.
Key Takeaways from ThredUp’s Q3 Results
It was good to see ThredUp beat analysts’ EPS expectations this quarter. We were also glad its full-year revenue guidance exceeded Wall Street’s estimates. Zooming out, we think this was a good print with some key areas of upside. The stock traded up 3.1% to $8.77 immediately following the results.
ThredUp may have had a good quarter, but does that mean you should invest right now? If you’re making that decision, you should consider the bigger picture of valuation, business qualities, as well as the latest earnings. We cover that in our actionable full research report which you can read here, it’s free for active Edge members.


