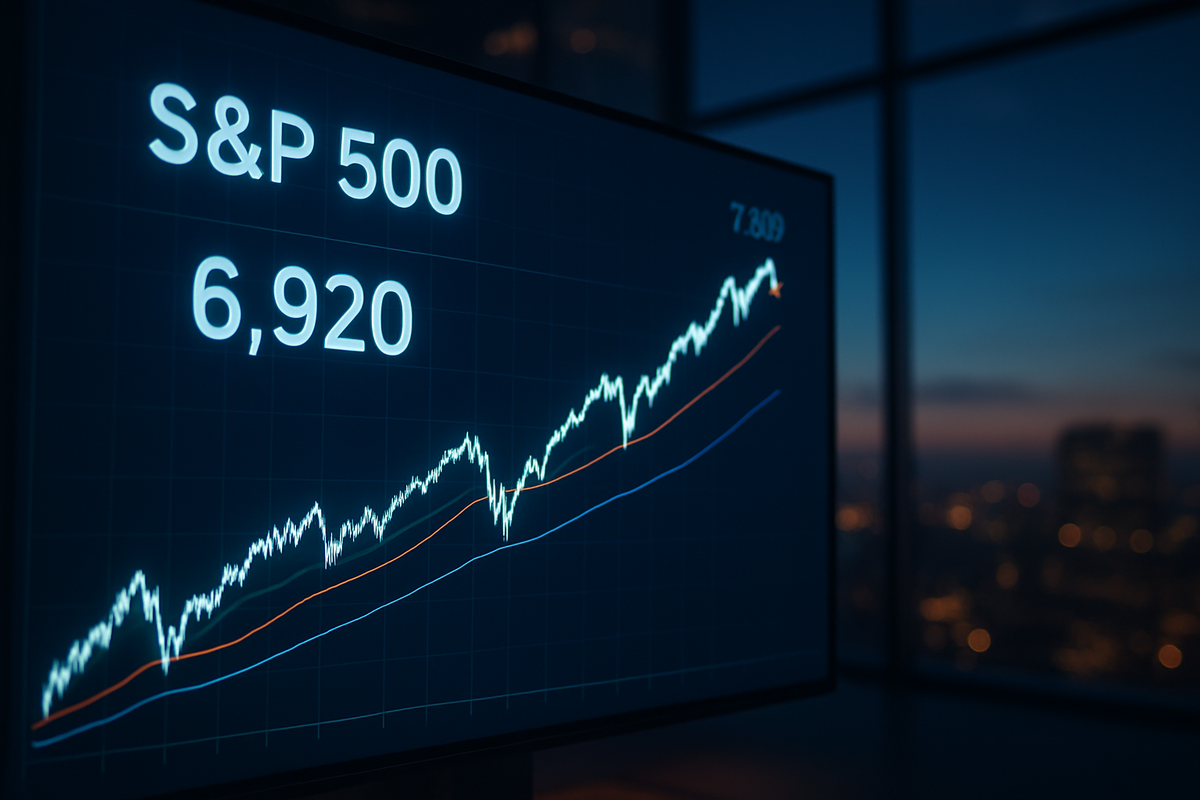
As the sun sets on a historic 2025, the S&P 500 (NYSE: SPY) is facing a moment of technical reckoning. After reaching a breathtaking all-time high of 6,932.05 on Christmas Eve, the index has entered a period of "valuation fatigue," retreating approximately 1.4% in the final trading sessions of the year. On this Monday, December 29, 2025, traders are closely watching whether the market’s "Santa Claus Rally" has enough fuel to push through the psychological 7,000 barrier or if a deeper correction is brewing for the new year.
The immediate implications of this pullback are twofold: institutional managers are aggressively locking in gains after a year that saw the S&P 500 surge nearly 20%, while retail investors are grappling with a "K-shaped" market reality. While AI titans have propelled the index to the stratosphere, broader market breadth has begun to thin, leaving the index vulnerable to technical breakdowns if key support levels fail to hold in the coming days.
The Technical Battleground: Deciphering the Pullback
The journey to nearly 7,000 points was not a straight line, but the momentum accelerated significantly following the Federal Reserve’s third rate cut of the year on December 10, which brought the federal funds rate down to a range of 3.5%–3.75%. This liquidity injection, combined with a "regulatory thaw" in Washington, propelled the index to its record peak on December 24. However, the post-Christmas sessions have been defined by strategic preservation. As of today, December 29, the index is hovering near 6,920, testing the resolve of "buy-the-dip" participants who have dominated the 2025 landscape.
Technical analysts are currently hyper-focused on a hierarchy of support levels. The immediate floor sits at 6,848, coinciding with the 20-day moving average. Should the selling pressure intensify, the primary support zone lies between 6,760 and 6,790, where the 50-day moving average currently rests. A breach below this level would be a significant signal of shifting short-term momentum. Further down, the structural floor is anchored by the 200-day moving average at 6,267—a level that has not been seriously threatened since the "Liberation Day" tariff volatility in April 2025.
Key indicators such as the Relative Strength Index (RSI) and the Moving Average Convergence Divergence (MACD) are flashing warning signs of "bearish divergence." Even as the S&P 500 notched new highs in late December, these momentum oscillators formed lower peaks, suggesting that the upward impulse is losing its internal strength. This divergence often precedes a period of consolidation or a tactical retreat, leading many floor traders to adopt a "wait-and-see" approach as the 2026 calendar approaches.
Giants at the Crossroads: Winners and Losers of the 2025 Surge
The primary drivers of this year’s record-breaking run have been the "Magnificent Seven," but their performance in late December has been a study in contrasts. Nvidia (NASDAQ: NVDA) remains the undisputed heavyweight champion, reaching a $5 trillion market valuation in October. However, the stock saw a 2% retreat this week as investors digested its massive $20 billion deal to license inference technology from Groq. Similarly, Microsoft (NASDAQ: MSFT), up 22% year-to-date, has seen its shares soften as the market evaluates the margin impact of its massive capital expenditures on "autonomous digital employees."
On the winning side of the late-year rotation, Apple (NASDAQ: AAPL) has reclaimed its crown, surging 38% this year. The success of the iPhone 17 Pro and the new "Apple Intelligence Pro" subscription model has provided a robust recurring revenue stream that shielded the stock from the worst of the December pullback. Alphabet (NASDAQ: GOOGL) has also been a standout, gaining 66% in 2025 on the back of its Gemini 3 model. Meanwhile, JPMorgan Chase (NYSE: JPM) has capitalized on the regulatory environment, with shares climbing 44% to trade near $327, supported by a massive $30 billion buyback program.
Conversely, some former darlings are ending the year on a somber note. Amazon (NASDAQ: AMZN) has significantly underperformed its mega-cap peers, posting only an 8% gain for 2025 as investors fretted over slowing cloud growth and the cost of reshoring logistics to mitigate tariff impacts. In the consumer space, Kohl’s (NYSE: KSS) and Moderna (NASDAQ: MRNA) have faced steep declines, with the former struggling against a "demand vacuum" caused by consumers front-loading purchases earlier in the year to avoid anticipated 2026 price hikes.
Macro Currents and the Shadow of "Liberation Day"
The current market volatility cannot be viewed in isolation from the broader industry trends of 2025, most notably the "Liberation Day" tariffs announced on April 2. These policies, which saw effective rates on Chinese imports peak at 145%, reshaped supply chains throughout the year. While the S&P 500 has proven resilient, the "tariff-fueled inflation" remains a persistent concern for 2026. The tech sector has responded by accelerating diversification; for instance, Apple now manufactures 20% of its iPhones in India, and Nvidia has pledged $500 billion to reshore AI chip manufacturing to the U.S.
Historically, the final week of the year is characterized by the "Santa Claus Rally," which typically yields an average gain of 1.3%. However, 2025’s version is being hampered by high household debt and the fact that the 10-year Treasury yield remains stubbornly above 4.1% despite the Fed's dovish pivot. This "yield stickiness" suggests that bond markets are pricing in a more inflationary environment for 2026 than equity bulls might like to admit.
The current situation mirrors the late-year consolidations of 2021 and 2023, where a period of extreme tech-led outperformance was followed by a broadening of the market. However, the scale of the AI-driven valuations in 2025 is unprecedented. With the S&P 500 trading at elevated price-to-earnings multiples, any sign that the Fed might pause its rate-cutting cycle in early 2026 could trigger a more severe test of the 200-day moving average.
The Road to 7,000: What Comes Next?
Looking ahead to the first quarter of 2026, the primary objective for bulls is the psychological 7,000 milestone. Most Wall Street strategists remain optimistic, with year-end 2026 targets ranging from 7,500 to 7,700. However, the path to those levels will likely require a strategic pivot from "AI hype" to "AI execution." Companies will need to prove that their massive infrastructure investments are translating into bottom-line growth, much like Apple has done with its AI subscription services.
In the short term, the market may see a "January Effect" where small-cap stocks, represented by the Russell 2000 (NYSEARCA:IWM), finally begin to play catch-up. Small caps have largely sat out the late-2025 rally, but lower interest rates could provide the necessary relief for these more debt-sensitive companies. Conversely, the "front-loading" of consumer purchases in late 2025 suggests that the retail sector may face a very quiet Q1, potentially leading to earnings misses for companies that failed to adapt to the shifting trade landscape.
The ultimate scenario for early 2026 hinges on the balance between disinflation and growth. If the Fed continues its cutting cycle and the "tariff shock" remains contained through successful trade negotiations, the S&P 500 could easily clear 7,000 by mid-January. However, if inflation re-accelerates, the market may be forced to undergo a "valuation reset" that could see the index revisit the 6,200 level before finding a durable bottom.
Final Thoughts: Navigating the 2026 Horizon
As we wrap up 2025, the key takeaway for investors is that while the long-term bull market remains intact, the "easy money" phase of the AI rally has likely concluded. The S&P 500’s retreat from 6,932 is a healthy and necessary cooling-off period after a year of relentless gains. The technical support levels at 6,848 and 6,790 will be the ultimate arbiters of the market's health in the coming weeks.
Moving forward, the market will likely shift from a "momentum-driven" environment to a "quality-driven" one. Investors should watch for a broadening of market participation beyond the mega-cap tech giants and keep a close eye on the 10-year Treasury yield as a barometer for inflation expectations. The 7,000 mark is within reach, but the market's ability to hold its current support levels will determine whether that milestone is reached with a bang or a whimper.
In the coming months, the focus will shift from the Federal Reserve back to corporate earnings and the evolving trade landscape. For those with a long-term horizon, the 2025 pullback represents a potential entry point, provided they are willing to navigate the volatility that a 7,000-point index inevitably brings.
This content is intended for informational purposes only and is not financial advice.


