
Every earnings season comes with its winners and losers. In most cases, an actual earnings beat doesn't matter as much as the forward guidance. There are numerous instances of stocks reporting strong EPS and revenue beats, but soft or lowered guidance is all the markets heard as shares get taken to the woodshed.
Among those stocks, there are only a handful that are worth giving a second look. Keep in mind that some companies may purposely lowball forward guidance to produce an even stronger beat when they report. Here are two companies in the computer and technology sector that delivered strong earnings results, but weak guidance caused each stock's shares to topple.
Smartsheet Inc.
Smartsheet Inc. (NYSE: SMAR) is a cloud-based workflow collaboration platform that enables teams and individuals to collaborate, plan and execute projects more effectively. Its project management platform lets you create tasks, assign them, collaborate and track progress in real time. Features like document sharing, in-line comments and discussions help to keep members on the same page.
Smartsheet also enables process automation, which lets users save time and reduce errors when performing repeatable tasks. While Smartsheet primarily services small and medium-sized businesses, the company has been expanding and growing its customers with annual recurring revenues (ARR) of $100,000 or more to 2,000 clients. The company competes with Asana Inc. (NYSE: ASAN) and Atlassian Co. (NASDAQ: TEAM).
Platform Features That Enable Remote Work
Users can set up automatic notifications, conditional formatting and triggers. Various reporting tools measure progress and perform data analytics. The platform is scalable, customizable, and has mobile access and integration with popular business programs. The company benefits from the secular trend towards remote work and the elastic office as workers still need a virtual space to collaborate.
EPS Beat as Revenues Climb 21%
Smartsheet reported its fiscal Q4 2024 EPS of 34 cents, beating analyst estimates of 18 cents by 16 cents. GAAP net loss was $9 million compared to $44.4 million in the year-ago period. Revenues rose 21% YoY to $256.9 million versus $255.2 million consensus analyst estimates. The company ended the year with $628.8 million in cash and cash equivalents. Get AI-powered insights on MarketBeat.
Smartsheet Offered Mixed Guidance
Smartsheet provided mixed guidance for Q1 2025 EPS of 26 cents to 27 cents, beating 20 cents consensus analyst estimates. Revenues are expected to be between $257 million and $259 million, falling short of the consensus estimate of $263.34 million. Fiscal full-year 2025 EPS is expected to be between $1.06 and $1.13, which is better than the consensus estimate of 93 cents. Revenues are expected to be between $1.113 billion and $1.118 billion, versus the consensus estimate of $1.14 billion.
Smartsheet CEO Mark Mader commented, "Strong demand from our enterprise customers helped us achieve the major milestone of $1 billion in annualized recurring revenue in Q4," said Mark Mader, CEO of Smartsheet. "Looking forward, we're setting the foundation for the next era of profitable growth with proven, more efficient go-to-market motions paired with enterprise-grade product innovation informed by decades of data, work patterns, and customer use cases."
Smartsheet analyst ratings and price targets are at MarketBeat. The MarketBeat stock screener can help you find Smartsheet's peers and competitor stocks.
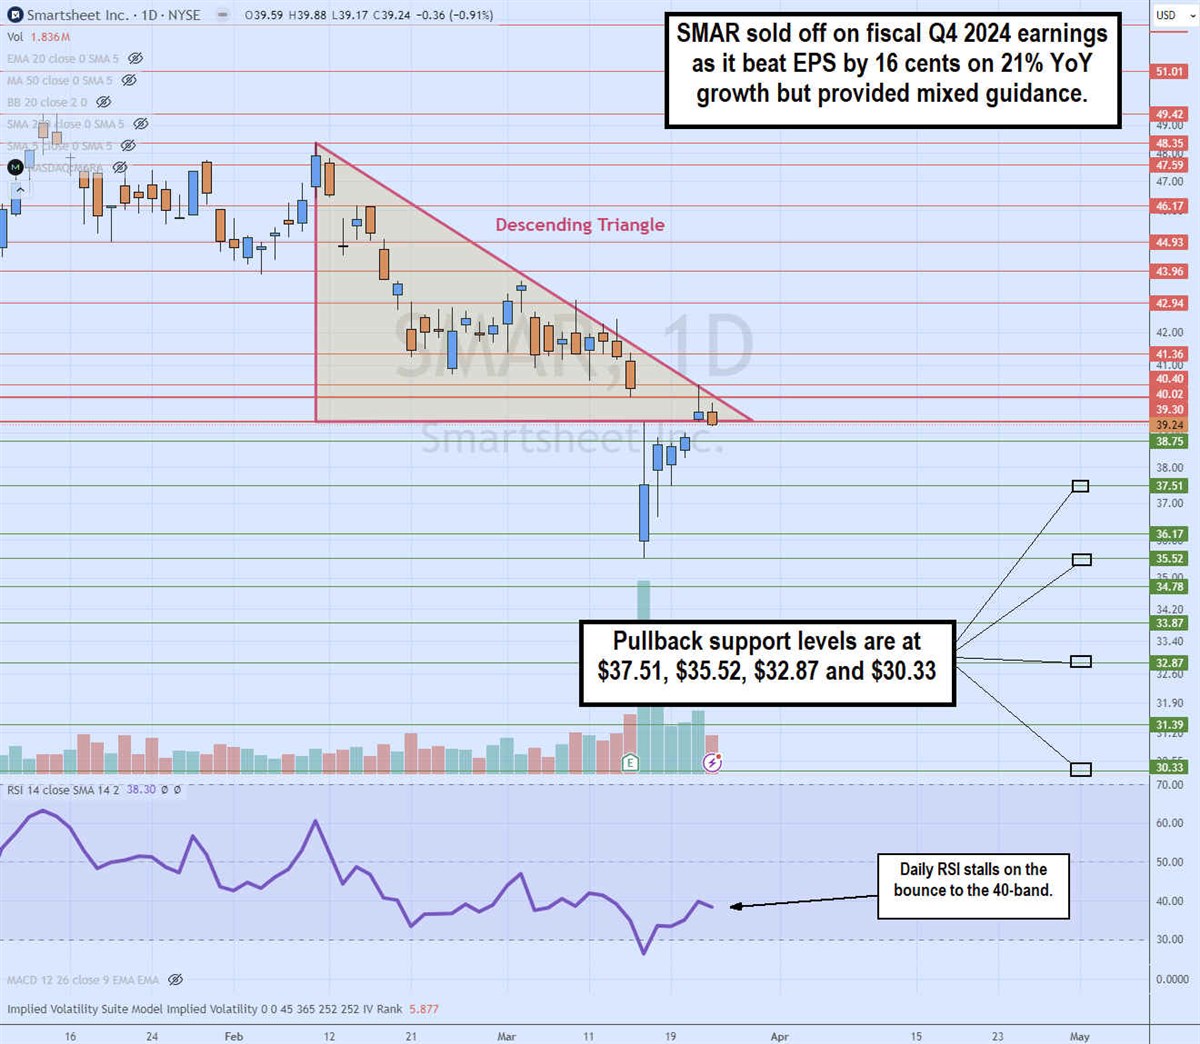 Daily Descending Triangle
The daily candlestick chart on SMAR illustrates a descending triangle pattern. The descending trendline started at $48.35 on February 9, 2024. SMAR fell to the $40.02 flat-bottom lower trendline. Shares collapsed through the lower trendline on its earnings release to $35.52, but they bounced back to regain the lower trendline support at $39.24. The daily relative strength index is bounced back to the 40-band. Pullback support levels are at $37.51, $35.52, $32.87 and $30.33.
PagerDuty
PagerDuty Inc. (NYSE: PD) is a cloud-based monitoring and incident management platform. The platform monitors an organization's IT infrastructure and applications, triggering real-time incident alerts. Alerts can be routed to appropriate personnel based on urgency. It enables robust features and integrations designed to focus on incident management. The platform also provides tools to identify root causes and analyze incident trends to prepare better for future reactions. The platform focuses on collaboration between different teams to promote quicker resolutions.
Stay on top of the stock market sectors on MarketBeat.
Steady Fiscal Q4 2024 Results
PagerDuty reported fiscal Q4 2024 EPS of 17 cents, beating 15 cents consensus analyst estimates by 2 cents. GAAP operating loss was $33.4 million, and non-GAAP operating income was $11 million. Revenues rose 10.1% YoY to $111.12 million vs $110.69 million consensus estimates. Annual recurring revenues (ARR) rose 10% YoY to $451.9 million. Customers with ARR over $100,00 rose to 804, up from 752 in the year-ago period. Customers with ARR over $1,000,000 rose to 57, up from 50 in the year-ago period.
Lowered Forward Guidance
PagerDuty provided downside forward guidance for fiscal Q1 2025 EPS of 12 cents to 13 cents versus 18 cents consensus estimates. Revenues are expected between $110.5 million to $112.5 million versus $113.86 million. Fiscal full year 2025 EPS is expected between 65 cents to 70 cents versus 82 cents consensus estimates. Revenues are expected between $470 million to $478 million versus $482.46 million.
PagerDuty CEO Jennifer Tejada commented, "While the volatile economic environment was challenging during FY '24, we have emerged stronger, more profitable, and well poised for accelerating growth during FY '25." Tejada continued, "Our confidence is founded in improving leading indicators like large-deal pipeline and conversion rates, stabilizing customer retention in mid-market and enterprise, an increased mix of multi-product, multi-year adds and expansion, and improved sales productivity."
PagerDuty analyst ratings and price targets are at MarketBeat.
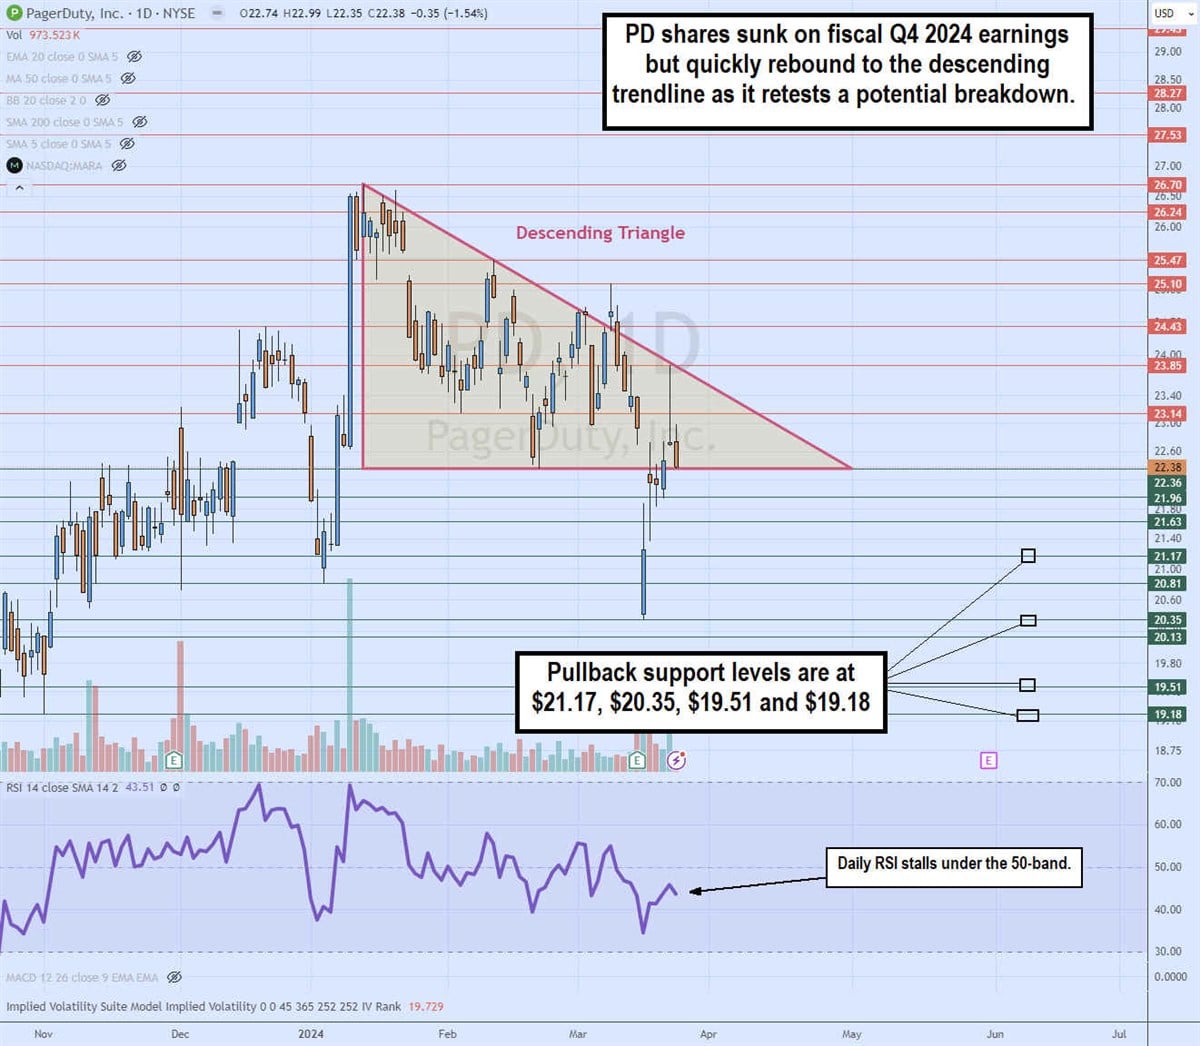
Daily Descending Triangle
The daily candlestick chart on PD illustrates a descending triangle pattern. The descending trendline formed at the $26.70 swing high on January 12, 2024. PD fell to the flat-bottom lower trendline at $22.38 while forming lower highs on bounces. PD initially collapsed through the triangle base on its fiscal Q4 2024 earnings release down to $20.35 but rebounded back to the $23.83 descending trendline before retesting the flat-bottom trendline again. The daily RSI is stalled under the 50-band. Pullback support levels are at $21.17, $20.35, $19.51 and $19.18.