The early weeks of 2026 have been defined by a mania in precious metals, with silver and gold smashing through all-time highs in a vertical, parabolic move. While the “gold bugs” are celebrating, the S&P 500 Materials Sector SPDR (XLB) tells a very different, and potentially more somber, story.
XLB tracks the companies that provide the raw building blocks for the global economy — chemicals, construction materials, and industrial metals like copper and aluminum. In a healthy bull market, you want to see these industrial materials rising alongside gold and silver.
However, right now, we are seeing a massive non-confirmation, so to speak, that every DIY investor needs to watch.
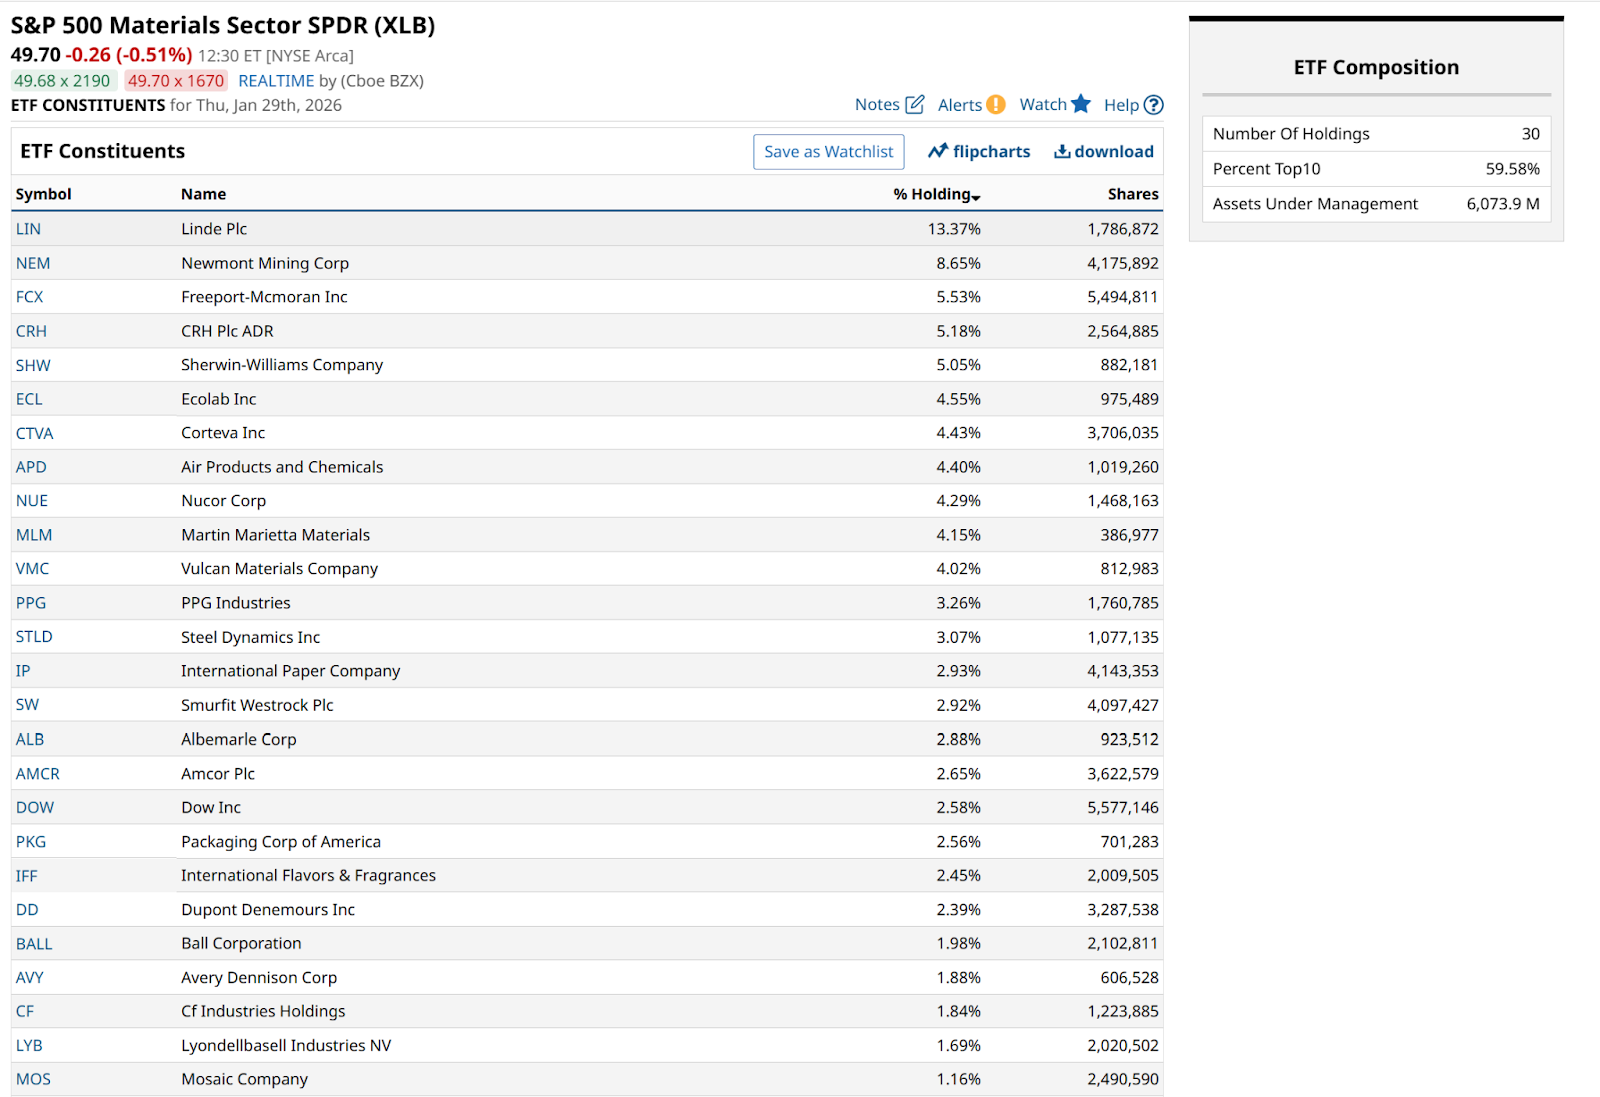
The holdings of XLB are essentially a “who’s who” of global industry, led by Linde PLC (LIN) (chemicals), Newmont Corp (NEM) (gold mining), and Freeport-McMoRan (FCX) (copper). Despite Newmont and Freeport benefiting from higher metal prices, XLB is struggling to keep pace with the S&P 500 Index ($SPX).
This divergence suggests that while investors are panicking into gold (GCG26) and silver (SIH26) as a hedge against a sinking dollar ($DXY), the actual industrial demand for materials is cooling. Chemical companies and construction materials providers, which make up nearly 65% of the fund, are seeing their margins squeezed by rising energy costs and slowing manufacturing data.
Historically, when precious metals go on a fear run while industrial materials lag, it’s a sign that the rally is built on speculation rather than economic reality. If the Silicon Renaissance were truly pulling the entire economy higher, we would see XLB leading the market.
Instead, the fund is churning near its 200-day moving average, unable to break above the resistance levels set in late 2025. For an investor, this is a canary in the coal mine. It suggests that the run in gold and silver may be reaching an exhaustion point. If the industrial side of the material world — the companies that actually use these metals to build things — cannot sustain a rally, the fear of trade in gold and silver will eventually run out of buyers.
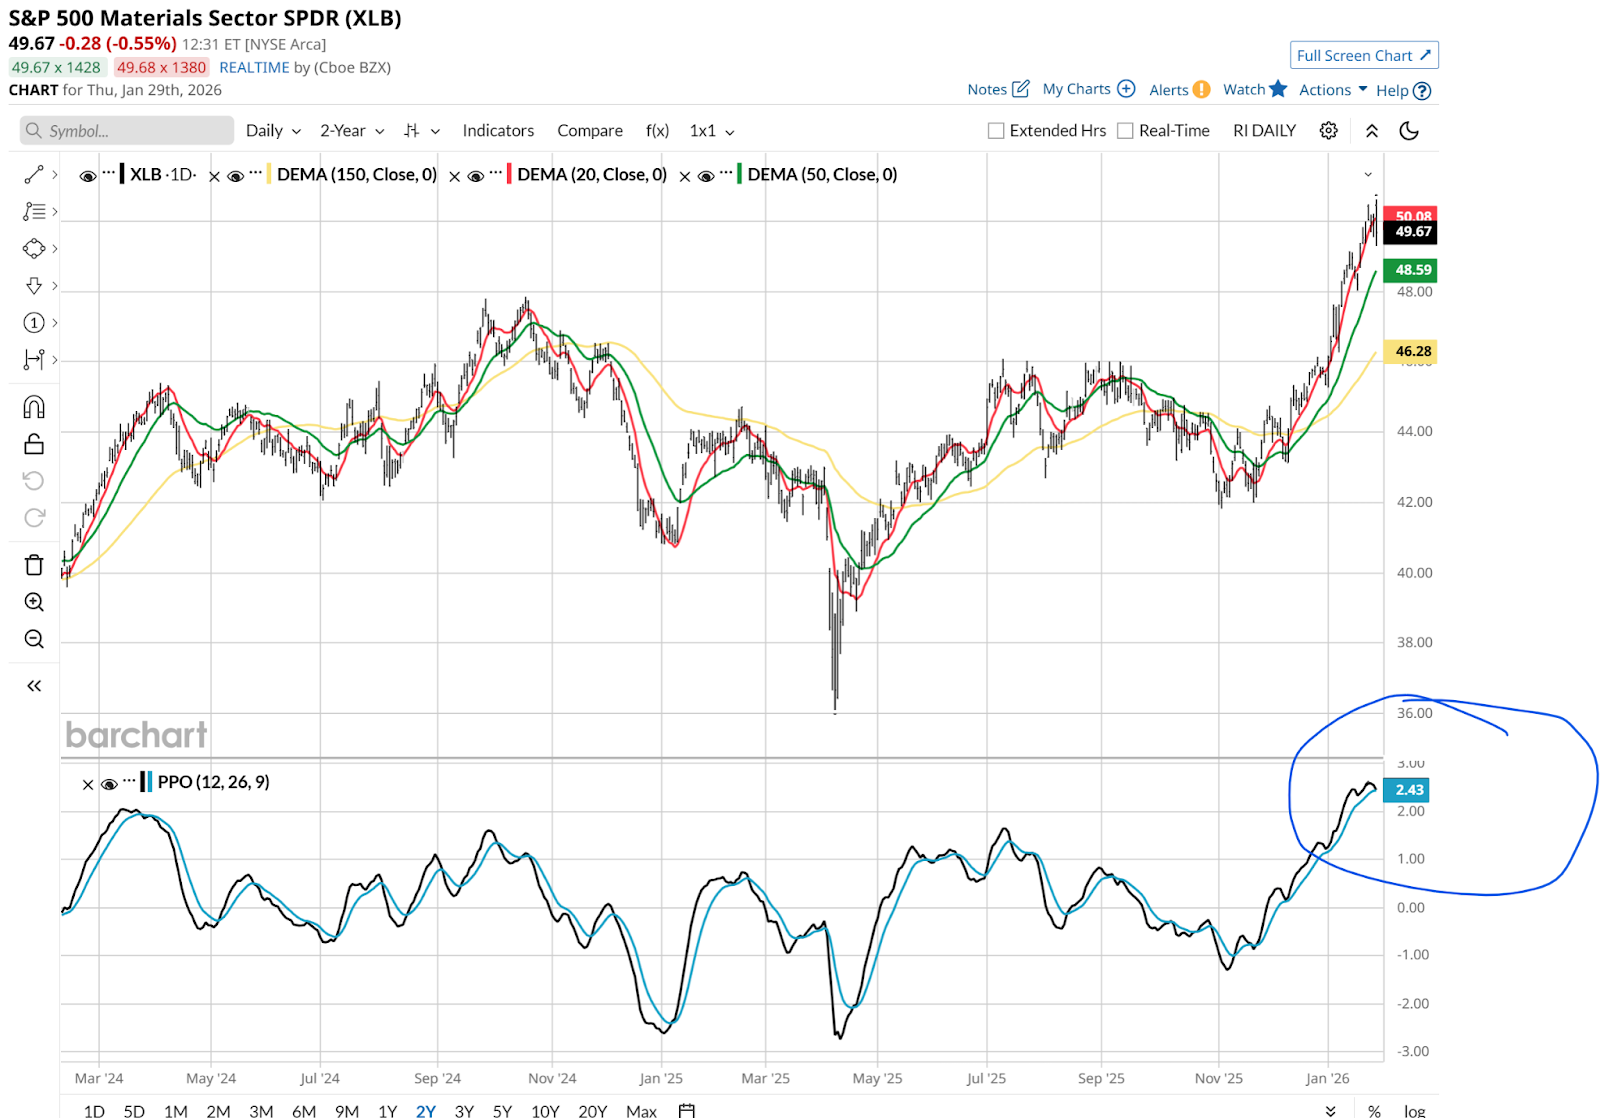
XLB’s Chart Says Be Careful
Here’s the daily. I don’t like the stretched nature of the price, and the sky-high Percentage Price Oscillator (PPO) level. That said, if energy stocks keep rallying, it could hedge away some of the topping that will ultimately occur in precious metals.
For a DIY investor, watching XLB is a great way to double-check your views on the underlying commodities sector. The stocks don’t stray from the metals and other commodity prices for too long. The materials sector is the truth teller of the market, and right now, it’s telling us to be very careful with the metals mania.
Rob Isbitts is a semi-retired fiduciary investment advisor and fund manager. Find his investment research at ETFYourself.com. To copy-trade Rob’s portfolios, check out the new PiTrade app.
On the date of publication, Rob Isbitts did not have (either directly or indirectly) positions in any of the securities mentioned in this article. All information and data in this article is solely for informational purposes. For more information please view the Barchart Disclosure Policy here.
More news from Barchart


