Casino, sports betting and entertainment operator PENN Entertainment (NASDAQ: PENN) announced better-than-expected revenue in Q4 CY2025, with sales up 8.2% year on year to $1.81 billion. Its non-GAAP profit of $0.07 per share was significantly above analysts’ consensus estimates.
Is now the time to buy PENN Entertainment? Find out by accessing our full research report, it’s free.
PENN Entertainment (PENN) Q4 CY2025 Highlights:
- Revenue: $1.81 billion vs analyst estimates of $1.76 billion (8.2% year-on-year growth, 2.6% beat)
- Adjusted EPS: $0.07 vs analyst estimates of -$0.16 (significant beat)
- Operating Margin: -1%, down from 2.4% in the same quarter last year
- Free Cash Flow was -$190.4 million compared to -$118.1 million in the same quarter last year
- Market Capitalization: $1.67 billion
Company Overview
Established in 1982, PENN Entertainment (NASDAQ: PENN) is a diversified American operator of casinos, sports betting, and entertainment venues.
Revenue Growth
A company’s long-term sales performance is one signal of its overall quality. Any business can experience short-term success, but top-performing ones enjoy sustained growth for years. Over the last five years, PENN Entertainment grew its sales at a 14.2% compounded annual growth rate. Though this growth is acceptable on an absolute basis, we need to see more than just topline growth for the consumer discretionary sector, which can display significant earnings volatility. This means our bar for the sector is particularly high, reflecting the non-essential and hit-driven nature of the products and services offered. Additionally, five-year CAGR starts around Covid, when revenue was depressed then rebounded.
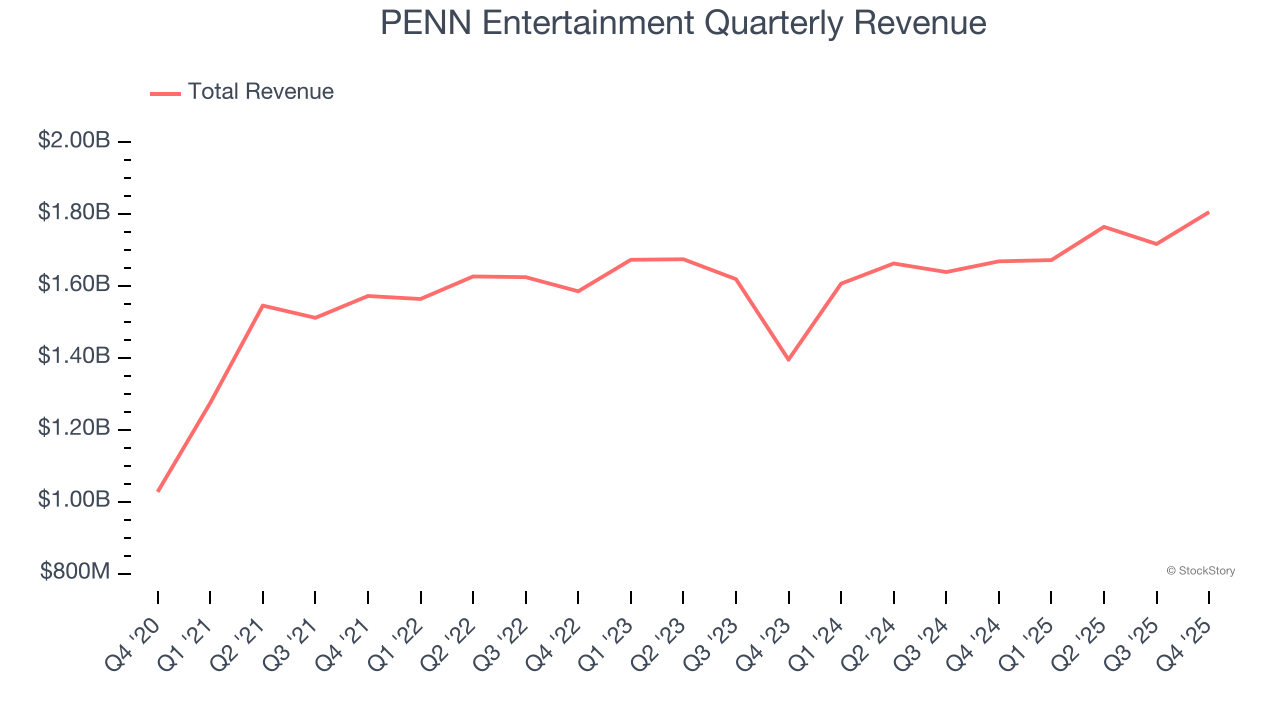
Long-term growth is the most important, but within consumer discretionary, product cycles are short and revenue can be hit-driven due to rapidly changing trends and consumer preferences. PENN Entertainment’s recent performance shows its demand has slowed as its annualized revenue growth of 4.6% over the last two years was below its five-year trend. We’re wary when companies in the sector see decelerations in revenue growth, as it could signal changing consumer tastes aided by low switching costs. Note that COVID hurt PENN Entertainment’s business in 2020 and part of 2021, and it bounced back in a big way thereafter. 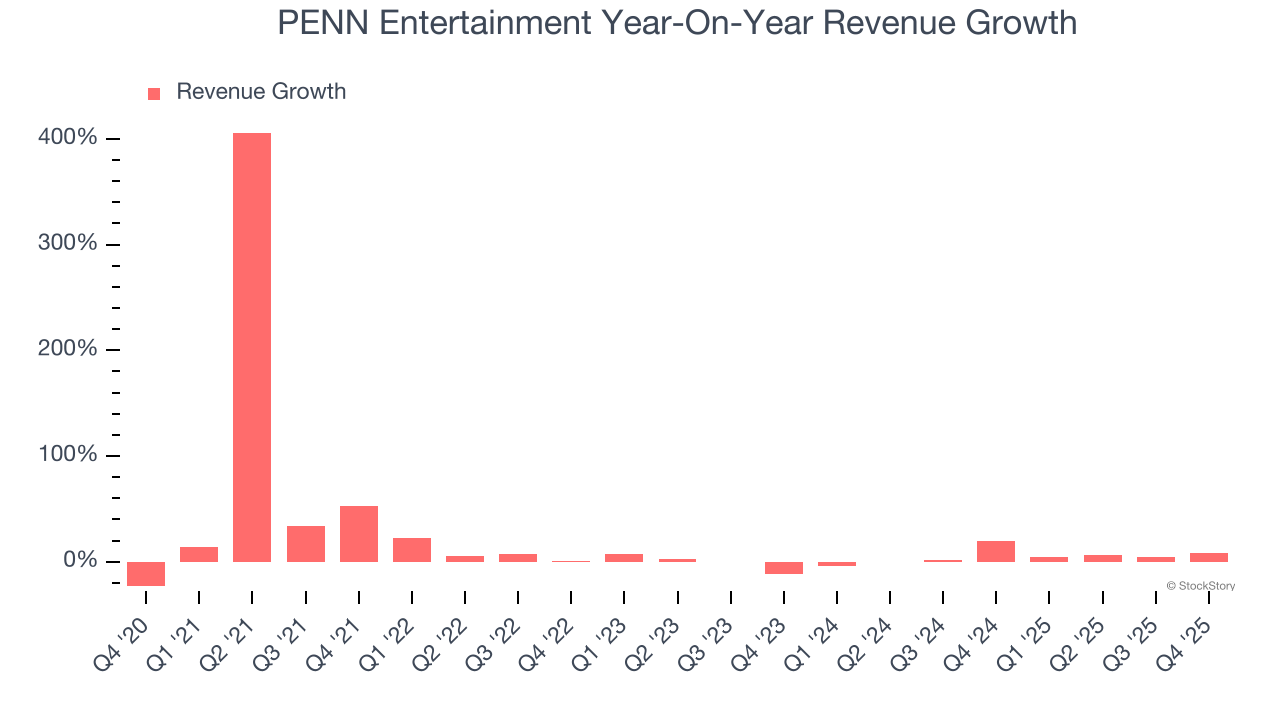
We can better understand the company’s revenue dynamics by analyzing its most important segment, Northeast Region. Over the last two years, PENN Entertainment’s Northeast Region revenue (casinos, hotels) averaged 1.2% year-on-year growth. This segment has lagged the company’s overall sales. 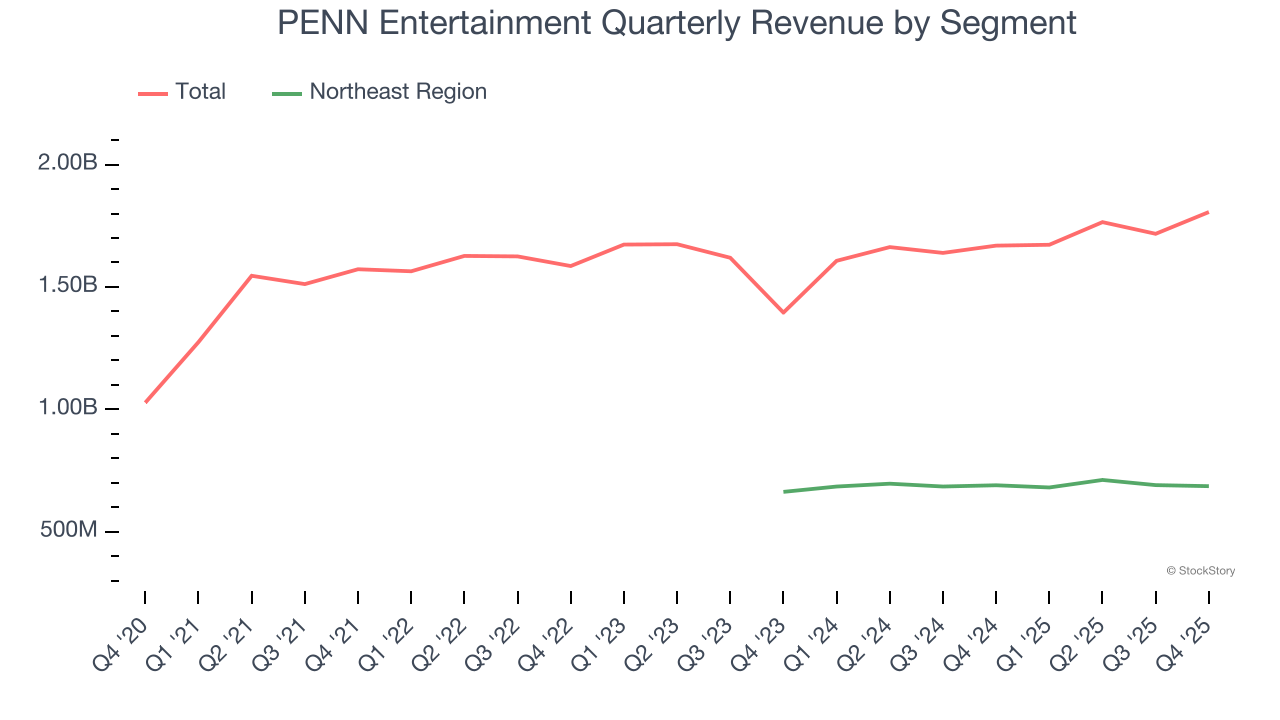
This quarter, PENN Entertainment reported year-on-year revenue growth of 8.2%, and its $1.81 billion of revenue exceeded Wall Street’s estimates by 2.6%.
Looking ahead, sell-side analysts expect revenue to grow 1.8% over the next 12 months, a slight deceleration versus the last two years. This projection is underwhelming and indicates its products and services will face some demand challenges.
The 1999 book Gorilla Game predicted Microsoft and Apple would dominate tech before it happened. Its thesis? Identify the platform winners early. Today, enterprise software companies embedding generative AI are becoming the new gorillas. a profitable, fast-growing enterprise software stock that is already riding the automation wave and looking to catch the generative AI next.
Operating Margin
Operating margin is a key measure of profitability. Think of it as net income - the bottom line - excluding the impact of taxes and interest on debt, which are less connected to business fundamentals.
PENN Entertainment’s operating margin might fluctuated slightly over the last 12 months but has generally stayed the same, averaging 2.4% over the last two years. This profitability was inadequate for a consumer discretionary business and caused by its suboptimal cost structure.
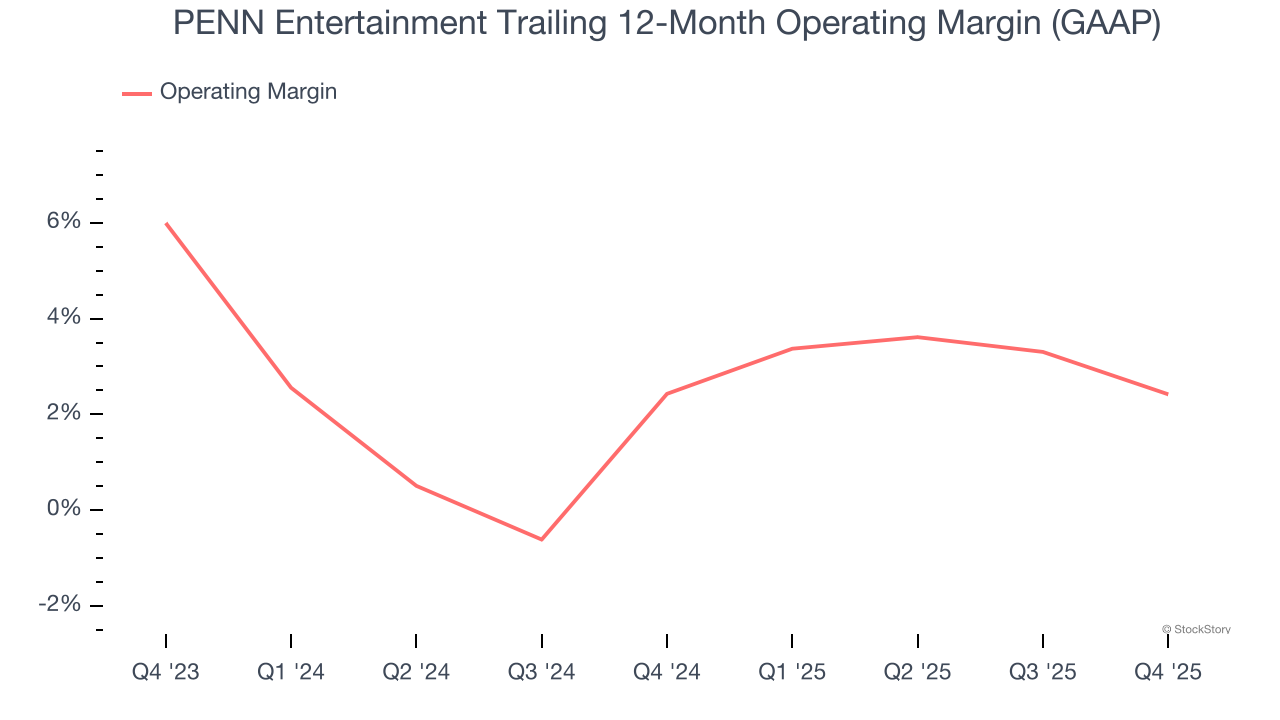
This quarter, PENN Entertainment’s breakeven margin was -1%, down 3.3 percentage points year on year. This contraction shows it was less efficient because its expenses grew faster than its revenue.
Earnings Per Share
We track the long-term change in earnings per share (EPS) for the same reason as long-term revenue growth. Compared to revenue, however, EPS highlights whether a company’s growth is profitable.
Although PENN Entertainment’s full-year earnings are still negative, it reduced its losses and improved its EPS by 23% annually over the last five years. The next few quarters will be critical for assessing its long-term profitability.
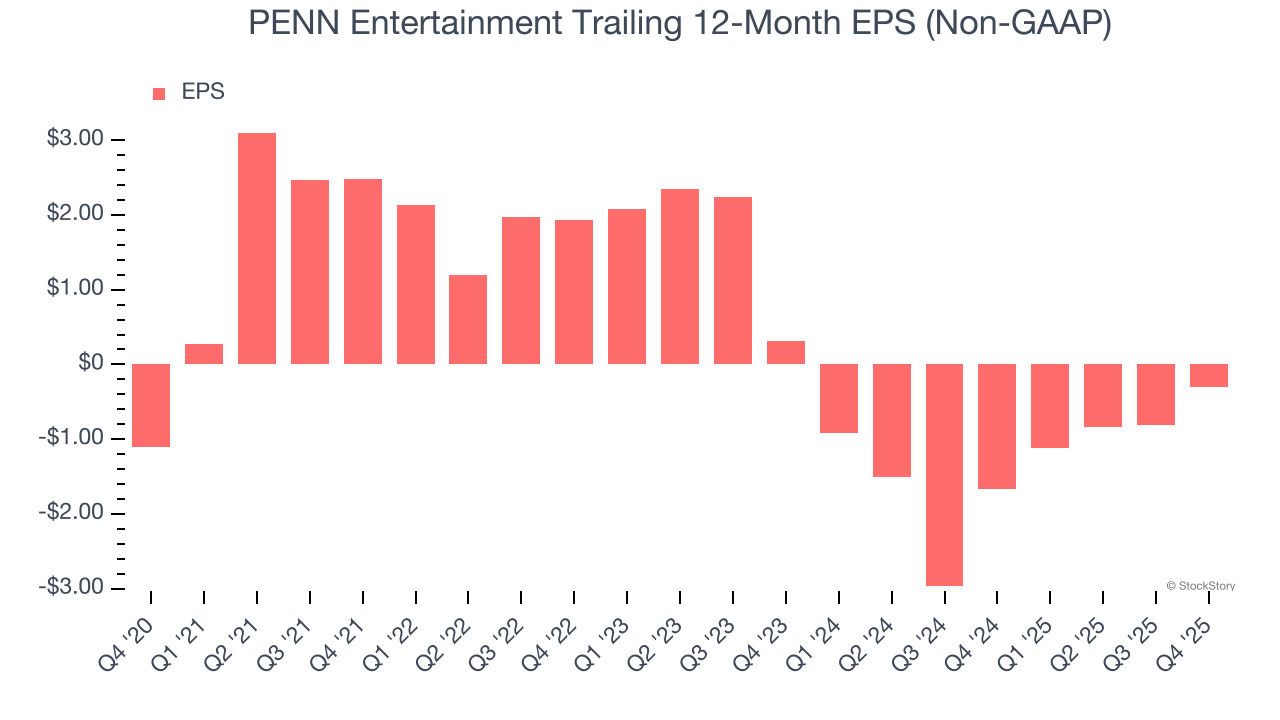
In Q4, PENN Entertainment reported adjusted EPS of $0.07, up from negative $0.44 in the same quarter last year. This print easily cleared analysts’ estimates, and shareholders should be content with the results. Over the next 12 months, Wall Street is optimistic. Analysts forecast PENN Entertainment’s full-year EPS of negative $0.30 will flip to positive $0.77.
Key Takeaways from PENN Entertainment’s Q4 Results
It was good to see PENN Entertainment beat analysts’ EPS expectations this quarter. We were also happy its revenue outperformed Wall Street’s estimates. On the other hand, its EBITDA missed. Overall, this print had some key positives. The stock traded up 6.5% to $13.35 immediately after reporting.
Is PENN Entertainment an attractive investment opportunity right now? What happened in the latest quarter matters, but not as much as longer-term business quality and valuation, when deciding whether to invest in this stock. We cover that in our actionable full research report which you can read here (it’s free).