Cash-back rewards platform Ibotta (NYSE: IBTA) reported Q4 CY2025 results topping the market’s revenue expectations, but sales fell by 10% year on year to $88.53 million. On top of that, next quarter’s revenue guidance ($80 million at the midpoint) was surprisingly good and 7.9% above what analysts were expecting. Its GAAP loss of $0.04 per share was $0.02 below analysts’ consensus estimates.
Is now the time to buy Ibotta? Find out by accessing our full research report, it’s free.
Ibotta (IBTA) Q4 CY2025 Highlights:
- Revenue: $88.53 million vs analyst estimates of $83.14 million (10% year-on-year decline, 6.5% beat)
- EPS (GAAP): -$0.04 vs analyst estimates of -$0.02 ($0.02 miss)
- Adjusted EBITDA: $13.72 million vs analyst estimates of $11.36 million (15.5% margin, 20.7% beat)
- Revenue Guidance for Q1 CY2026 is $80 million at the midpoint, above analyst estimates of $74.14 million
- EBITDA guidance for Q1 CY2026 is $7 million at the midpoint, above analyst estimates of $6.40 million
- Operating Margin: -1.9%, down from 13.2% in the same quarter last year
- Free Cash Flow Margin: 18.8%, similar to the same quarter last year
- Total Redemptions: 73.98 million at quarter end
- Market Capitalization: $546.3 million
Company Overview
Originally launched as a way to make grocery shopping more rewarding for budget-conscious consumers, Ibotta (NYSE: IBTA) is a mobile shopping app that allows consumers to earn cash back on everyday purchases by completing tasks and submitting receipts.
Revenue Growth
A company’s long-term performance is an indicator of its overall quality. Any business can have short-term success, but a top-tier one grows for years.
With $342.4 million in revenue over the past 12 months, Ibotta is a small player in the business services space, which sometimes brings disadvantages compared to larger competitors benefiting from economies of scale and numerous distribution channels. On the bright side, it can grow faster because it has more room to expand.
As you can see below, Ibotta’s 23.3% annualized revenue growth over the last three years was incredible. This is an encouraging starting point for our analysis because it shows Ibotta’s demand was higher than many business services companies.
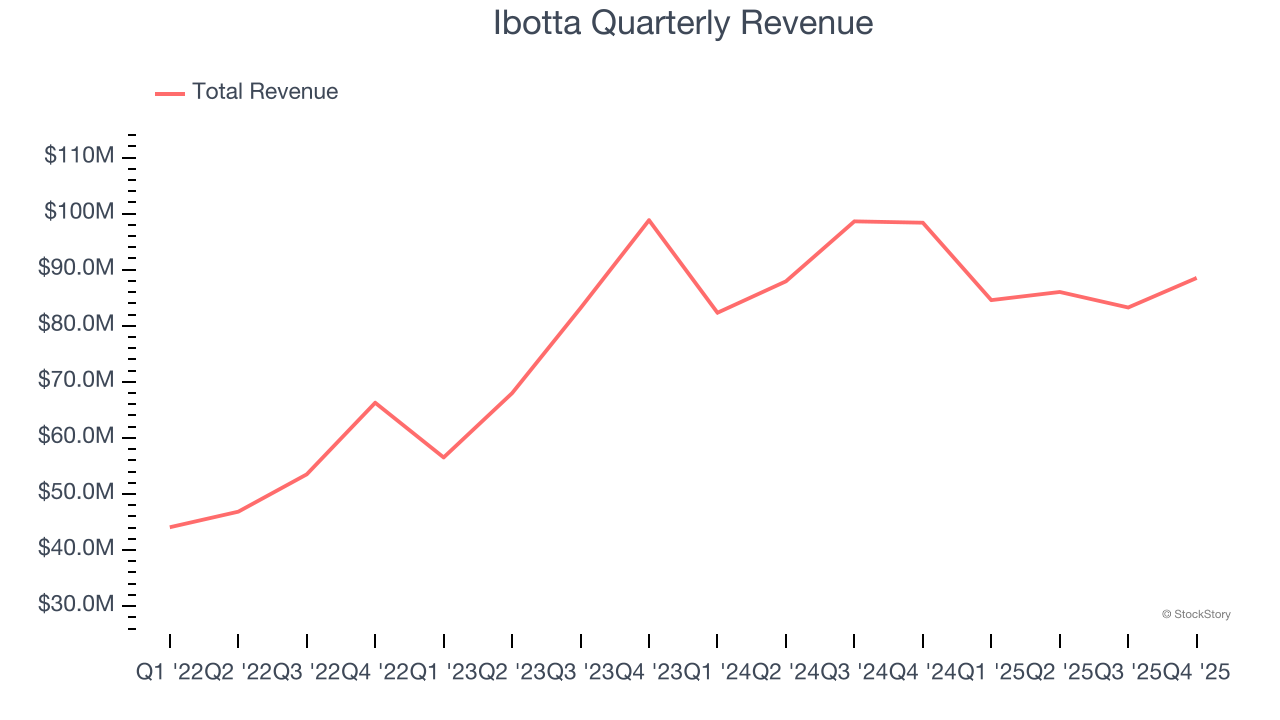
Long-term growth is the most important, but within business services, a stretched historical view may miss new innovations or demand cycles. Ibotta’s annualized revenue growth of 5.7% over the last two years is below its three-year trend, but we still think the results were respectable. 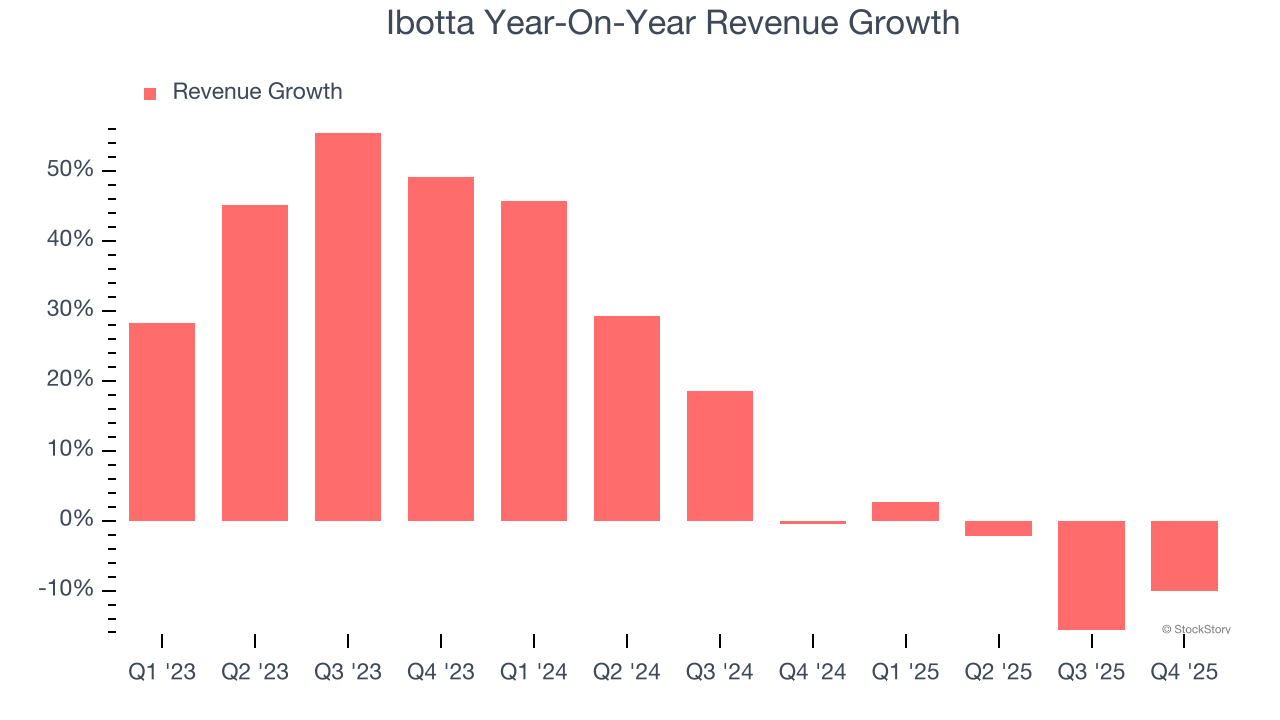
This quarter, Ibotta’s revenue fell by 10% year on year to $88.53 million but beat Wall Street’s estimates by 6.5%. Company management is currently guiding for a 5.4% year-on-year decline in sales next quarter.
Looking further ahead, sell-side analysts expect revenue to decline by 6.2% over the next 12 months, a deceleration versus the last two years. This projection doesn't excite us and implies its products and services will see some demand headwinds. At least the company is tracking well in other measures of financial health.
The 1999 book Gorilla Game predicted Microsoft and Apple would dominate tech before it happened. Its thesis? Identify the platform winners early. Today, enterprise software companies embedding generative AI are becoming the new gorillas. a profitable, fast-growing enterprise software stock that is already riding the automation wave and looking to catch the generative AI next.
Operating Margin
Operating margin is a key measure of profitability. Think of it as net income - the bottom line - excluding the impact of taxes and interest on debt, which are less connected to business fundamentals.
Ibotta was profitable over the last four years but held back by its large cost base. Its average operating margin of 3.5% was weak for a business services business.
On the plus side, Ibotta’s operating margin rose by 18.9 percentage points over the last four years, as its sales growth gave it immense operating leverage.
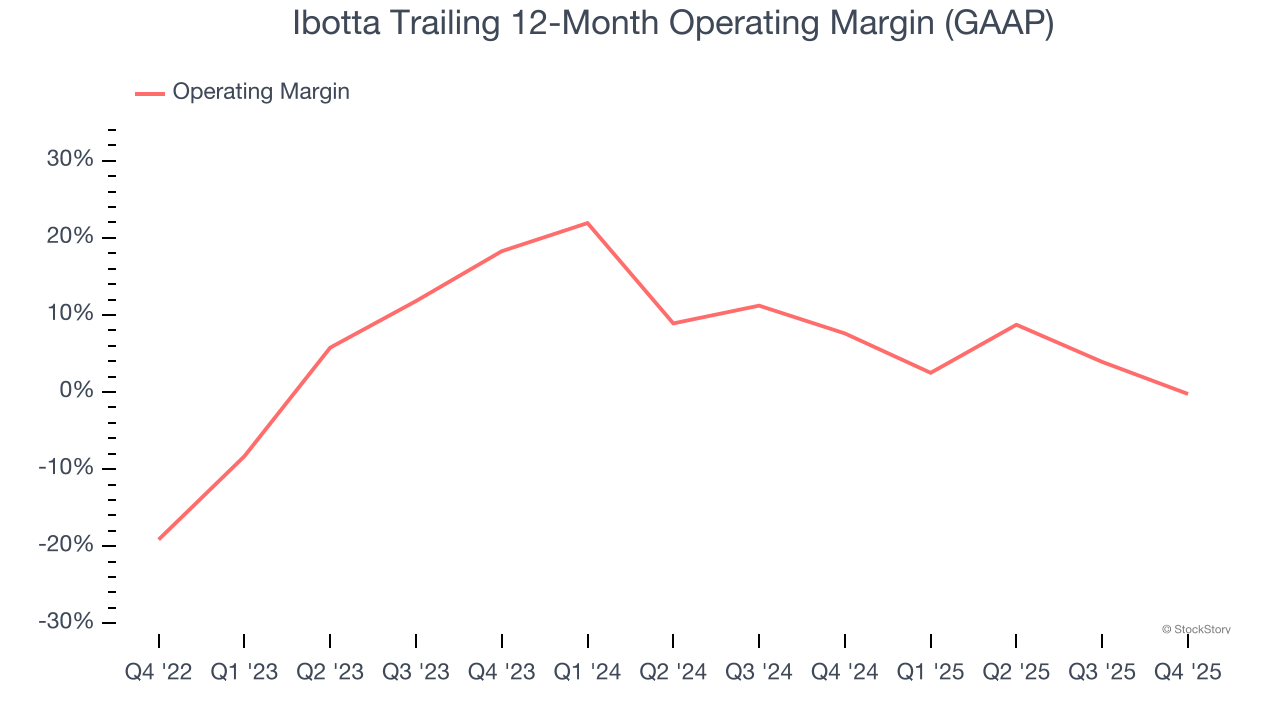
This quarter, Ibotta generated an operating margin profit margin of negative 1.9%, down 15 percentage points year on year. This contraction shows it was less efficient because its expenses increased relative to its revenue.
Earnings Per Share
Revenue trends explain a company’s historical growth, but the long-term change in earnings per share (EPS) points to the profitability of that growth – for example, a company could inflate its sales through excessive spending on advertising and promotions.
Ibotta’s full-year EPS flipped from negative to positive over the last three years. This is a good sign and shows it’s at an inflection point.
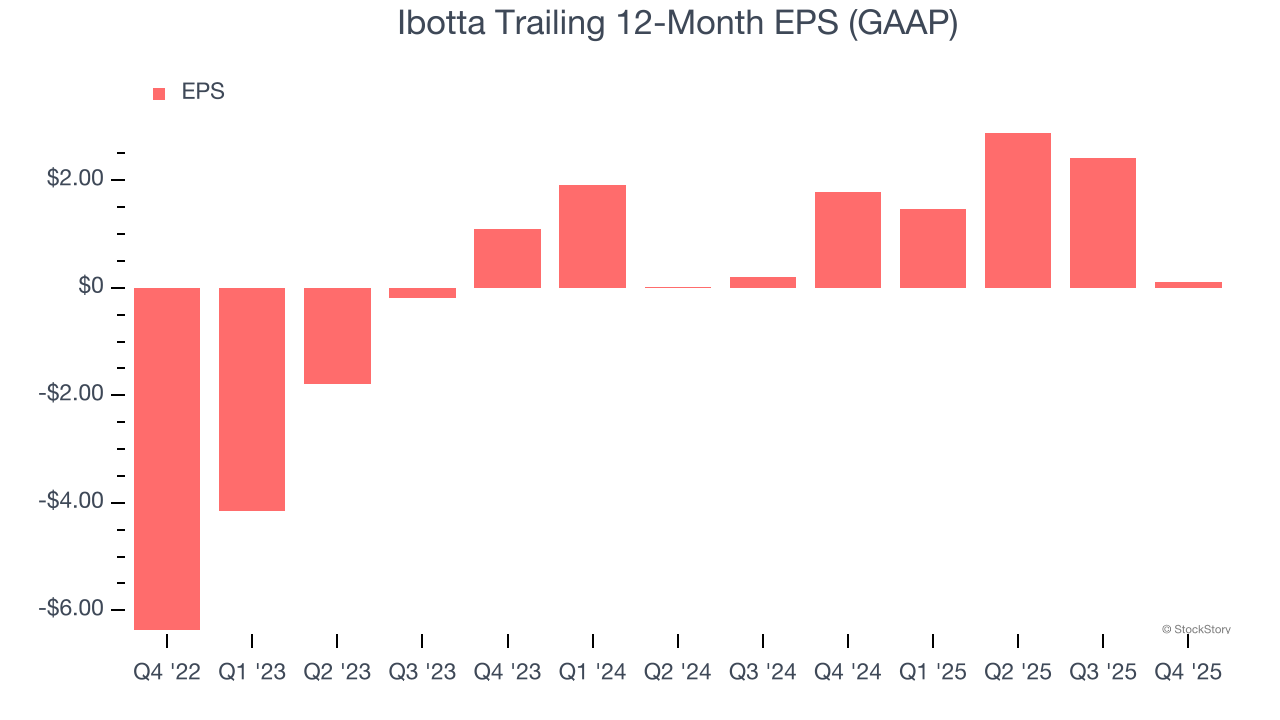
Like with revenue, we analyze EPS over a more recent period because it can provide insight into an emerging theme or development for the business.
In Q4, Ibotta reported EPS of negative $0.04, down from $2.27 in the same quarter last year. This print missed analysts’ estimates, but we care more about long-term EPS growth than short-term movements. Over the next 12 months, Wall Street expects Ibotta to perform poorly. Analysts forecast its full-year EPS of $0.11 will invert to negative negative $0.64.
Key Takeaways from Ibotta’s Q4 Results
We were impressed by how significantly Ibotta blew past analysts’ revenue expectations this quarter. We were also glad its revenue guidance for next quarter trumped Wall Street’s estimates. On the other hand, its EPS was in line. Overall, this print had some key positives. The stock traded up 26.4% to $26 immediately following the results.
Ibotta may have had a good quarter, but does that mean you should invest right now? The latest quarter does matter, but not nearly as much as longer-term fundamentals and valuation, when deciding if the stock is a buy. We cover that in our actionable full research report which you can read here (it’s free).


