
Energy and industrial distributor DistributionNOW (NYSE: DNOW) reported Q1 CY2025 results beating Wall Street’s revenue expectations, with sales up 6.4% year on year to $599 million. Its non-GAAP profit of $0.22 per share was 26.9% above analysts’ consensus estimates.
Is now the time to buy DistributionNOW? Find out by accessing our full research report, it’s free.
DistributionNOW (DNOW) Q1 CY2025 Highlights:
- Revenue: $599 million vs analyst estimates of $587.8 million (6.4% year-on-year growth, 1.9% beat)
- Adjusted EPS: $0.22 vs analyst estimates of $0.17 (26.9% beat)
- Adjusted EBITDA: $46 million vs analyst estimates of $40.4 million (7.7% margin, 13.9% beat)
- Operating Margin: 5%, in line with the same quarter last year
- Free Cash Flow was -$22 million, down from $80 million in the same quarter last year
- Market Capitalization: $1.74 billion
Company Overview
Spun off from National Oilwell Varco, DistributionNOW (NYSE: DNOW) provides distribution and supply chain solutions for the energy and industrial end markets.
Sales Growth
A company’s long-term sales performance is one signal of its overall quality. Any business can have short-term success, but a top-tier one grows for years. Over the last five years, DistributionNOW’s demand was weak and its revenue declined by 2.8% per year. This was below our standards and is a sign of poor business quality.
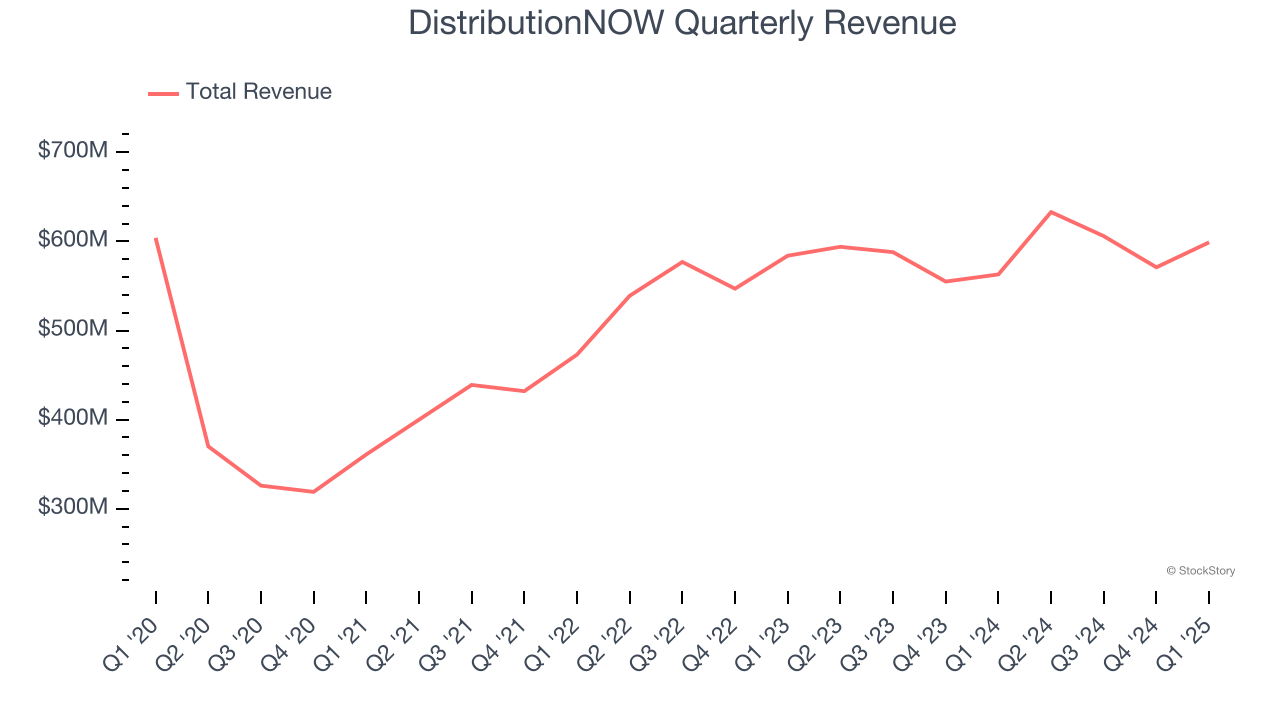
We at StockStory place the most emphasis on long-term growth, but within industrials, a half-decade historical view may miss cycles, industry trends, or a company capitalizing on catalysts such as a new contract win or a successful product line. DistributionNOW’s annualized revenue growth of 3.5% over the last two years is above its five-year trend, but we were still disappointed by the results. 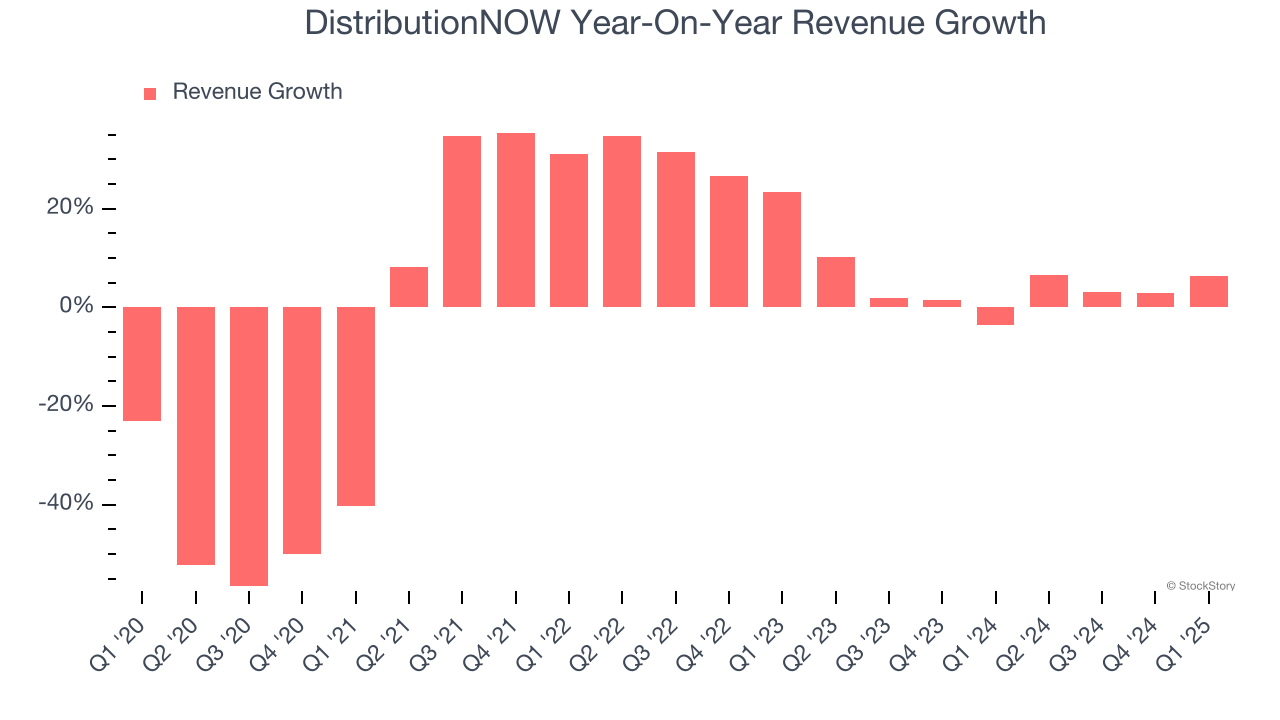
This quarter, DistributionNOW reported year-on-year revenue growth of 6.4%, and its $599 million of revenue exceeded Wall Street’s estimates by 1.9%.
Looking ahead, sell-side analysts expect revenue to grow 4.2% over the next 12 months, similar to its two-year rate. This projection doesn't excite us and indicates its newer products and services will not catalyze better top-line performance yet.
Software is eating the world and there is virtually no industry left that has been untouched by it. That drives increasing demand for tools helping software developers do their jobs, whether it be monitoring critical cloud infrastructure, integrating audio and video functionality, or ensuring smooth content streaming. Click here to access a free report on our 3 favorite stocks to play this generational megatrend.
Operating Margin
DistributionNOW was profitable over the last five years but held back by its large cost base. Its average operating margin of 3.3% was weak for an industrials business. This result isn’t too surprising given its low gross margin as a starting point.
On the plus side, DistributionNOW’s operating margin rose by 11.7 percentage points over the last five years.
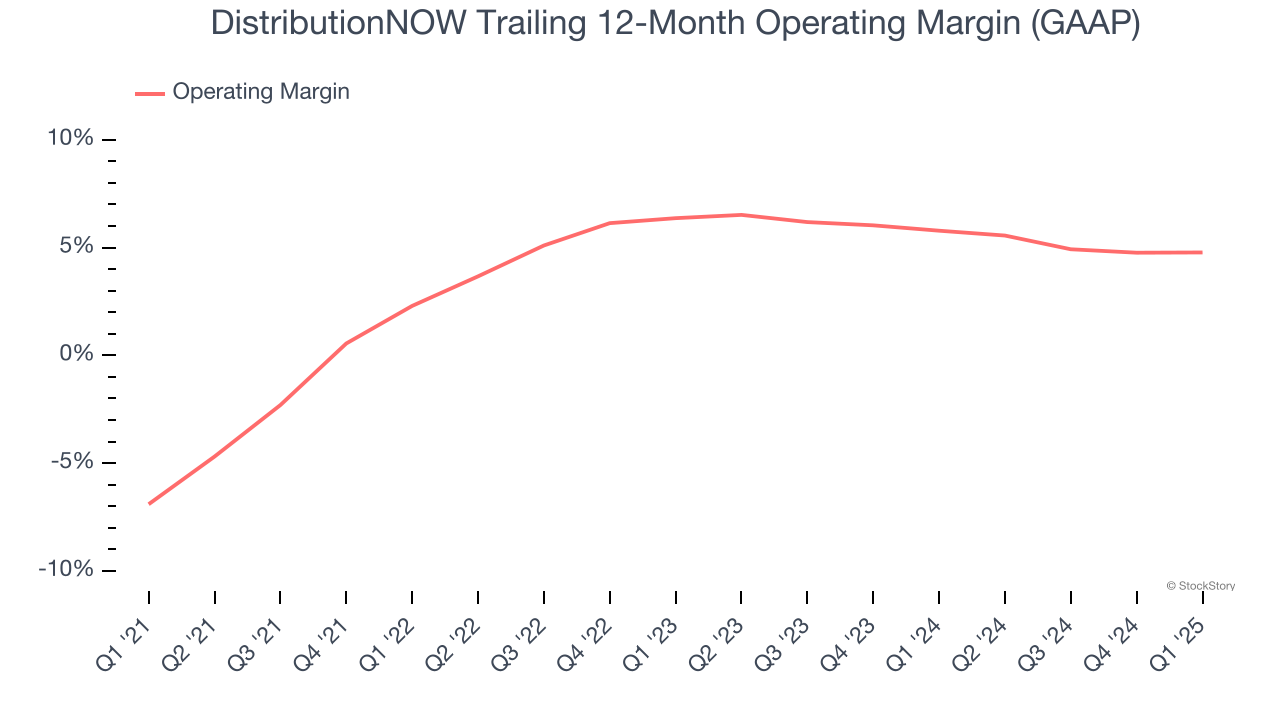
This quarter, DistributionNOW generated an operating profit margin of 5%, in line with the same quarter last year. This indicates the company’s cost structure has recently been stable.
Earnings Per Share
Revenue trends explain a company’s historical growth, but the long-term change in earnings per share (EPS) points to the profitability of that growth – for example, a company could inflate its sales through excessive spending on advertising and promotions.
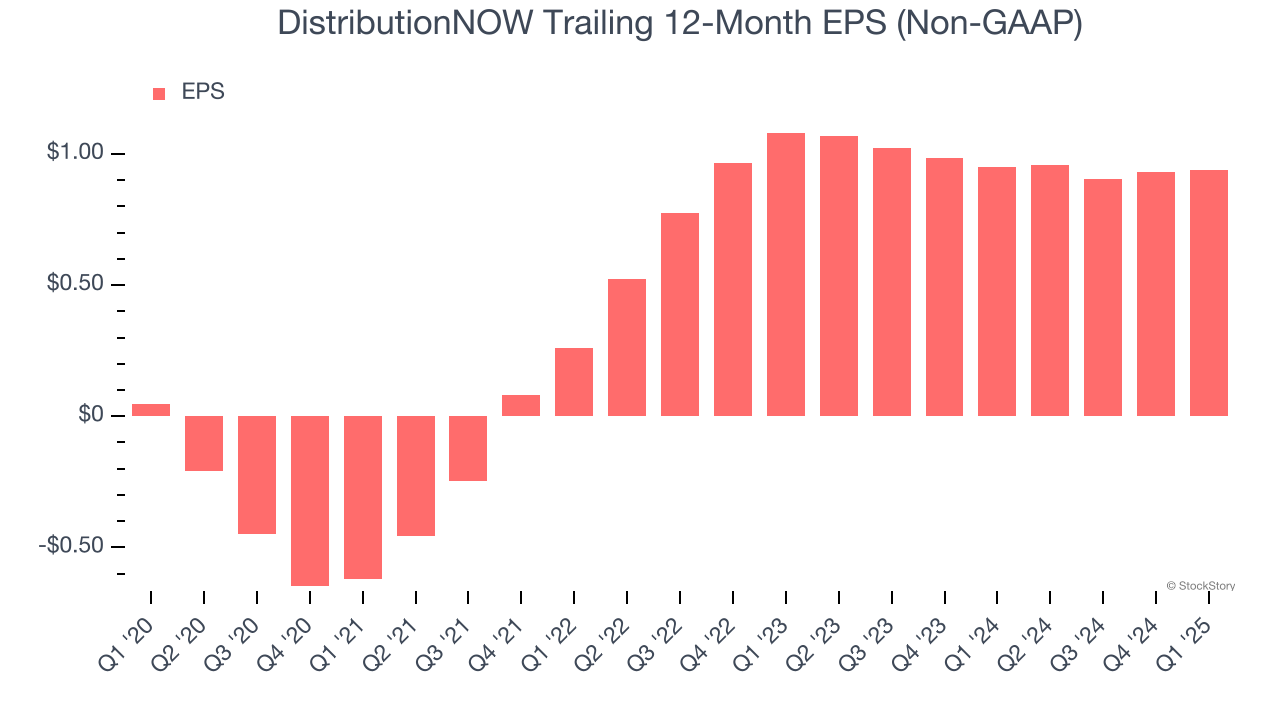
DistributionNOW’s EPS grew at an astounding 82.8% compounded annual growth rate over the last five years, higher than its 2.8% annualized revenue declines. This tells us management adapted its cost structure in response to a challenging demand environment.
Diving into the nuances of DistributionNOW’s earnings can give us a better understanding of its performance. As we mentioned earlier, DistributionNOW’s operating margin was flat this quarter but expanded by 11.7 percentage points over the last five years. On top of that, its share count shrank by 2.1%. These are positive signs for shareholders because improving profitability and share buybacks turbocharge EPS growth relative to revenue growth. 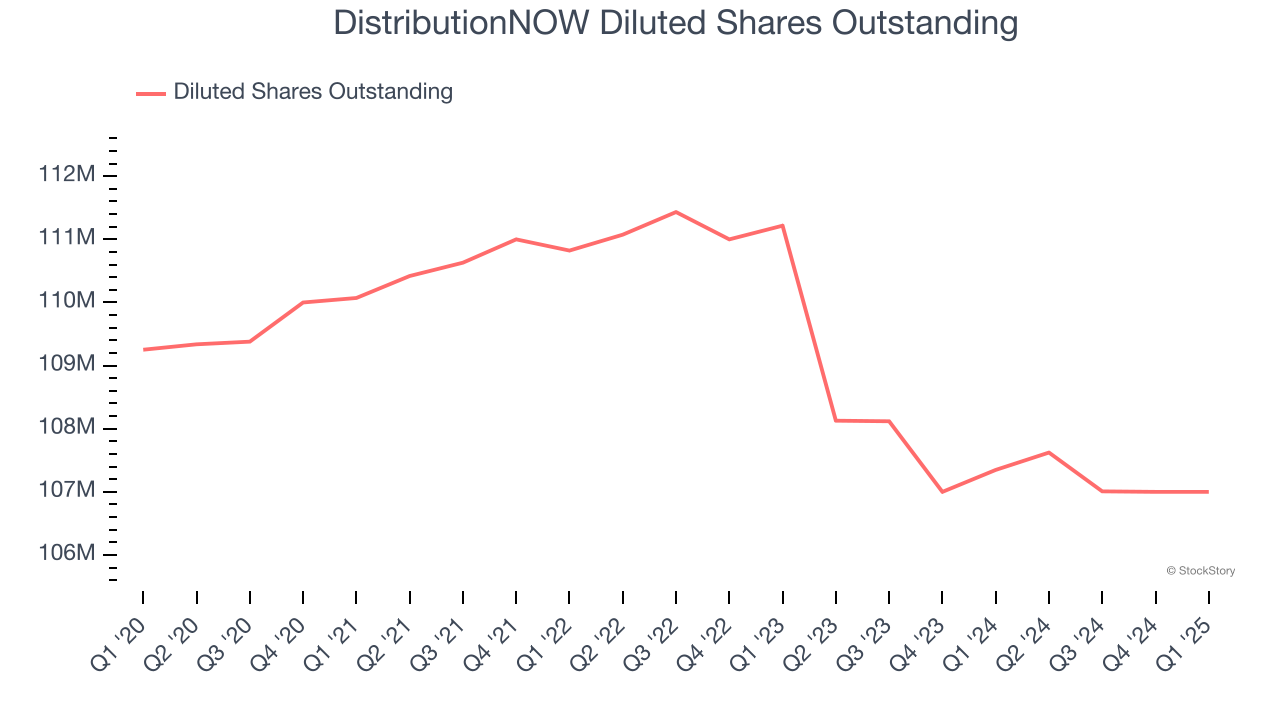
Like with revenue, we analyze EPS over a more recent period because it can provide insight into an emerging theme or development for the business.
For DistributionNOW, its two-year annual EPS declines of 6.9% mark a reversal from its (seemingly) healthy five-year trend. We hope DistributionNOW can return to earnings growth in the future.
In Q1, DistributionNOW reported EPS at $0.22, in line with the same quarter last year. This print easily cleared analysts’ estimates, and shareholders should be content with the results. We also like to analyze expected EPS growth based on Wall Street analysts’ consensus projections, but there is insufficient data.
Key Takeaways from DistributionNOW’s Q1 Results
We were impressed by how significantly DistributionNOW blew past analysts’ EPS expectations this quarter. We were also excited its EBITDA outperformed Wall Street’s estimates by a wide margin. Zooming out, we think this quarter featured some important positives, but shares traded down 5% to $15.21 immediately after reporting.
Is DistributionNOW an attractive investment opportunity right now? When making that decision, it’s important to consider its valuation, business qualities, as well as what has happened in the latest quarter. We cover that in our actionable full research report which you can read here, it’s free.


