
Healthcare distributor Cencora (NYSE: COR) met Wall Street’s revenue expectations in Q1 CY2025, with sales up 10.3% year on year to $75.45 billion. Its non-GAAP profit of $4.42 per share was 7.9% above analysts’ consensus estimates.
Is now the time to buy Cencora? Find out by accessing our full research report, it’s free.
Cencora (COR) Q1 CY2025 Highlights:
- Revenue: $75.45 billion vs analyst estimates of $75.7 billion (10.3% year-on-year growth, in line)
- Adjusted EPS: $4.42 vs analyst estimates of $4.10 (7.9% beat)
- Adjusted EBITDA: $1.30 billion vs analyst estimates of $1.22 billion (1.7% margin, 6.1% beat)
- 2025 Guidance: Adjusted EPS of $15.70 to $15.95, up from the previous $15.30 to $15.60 (beat)
- Operating Margin: 1.4%, in line with the same quarter last year
- Free Cash Flow was $3.22 billion, up from -$991.2 million in the same quarter last year
- Market Capitalization: $56.39 billion
“Cencora’s second quarter results reflect the strength of our value proposition as a healthcare services provider and the important role we play in the supply chain, driven by our pharmaceutical distribution footprint and complementary end-to-end services and solutions,” said Robert P. Mauch, President and Chief Executive Officer of Cencora.
Company Overview
Formerly known as AmerisourceBergen until its 2023 rebranding, Cencora (NYSE: COR) is a global pharmaceutical distribution company that connects manufacturers with healthcare providers while offering logistics, data analytics, and consulting services.
Sales Growth
A company’s long-term sales performance is one signal of its overall quality. Any business can have short-term success, but a top-tier one grows for years. Luckily, Cencora’s sales grew at a decent 10.8% compounded annual growth rate over the last five years. Its growth was slightly above the average healthcare company and shows its offerings resonate with customers.
We at StockStory place the most emphasis on long-term growth, but within healthcare, a half-decade historical view may miss recent innovations or disruptive industry trends. Cencora’s annualized revenue growth of 11.9% over the last two years is above its five-year trend, suggesting some bright spots. 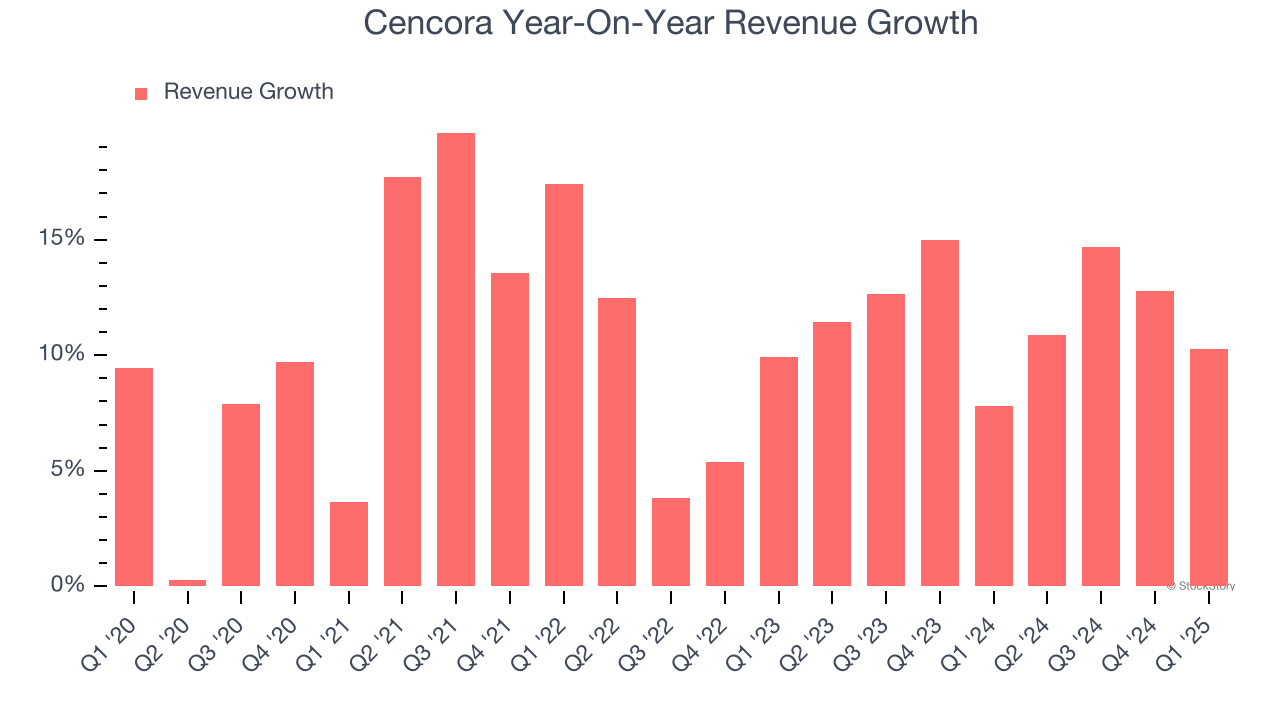
Cencora also breaks out the revenue for its most important segment, US Healthcare. Over the last two years, Cencora’s US Healthcare revenue averaged 12.8% year-on-year growth.
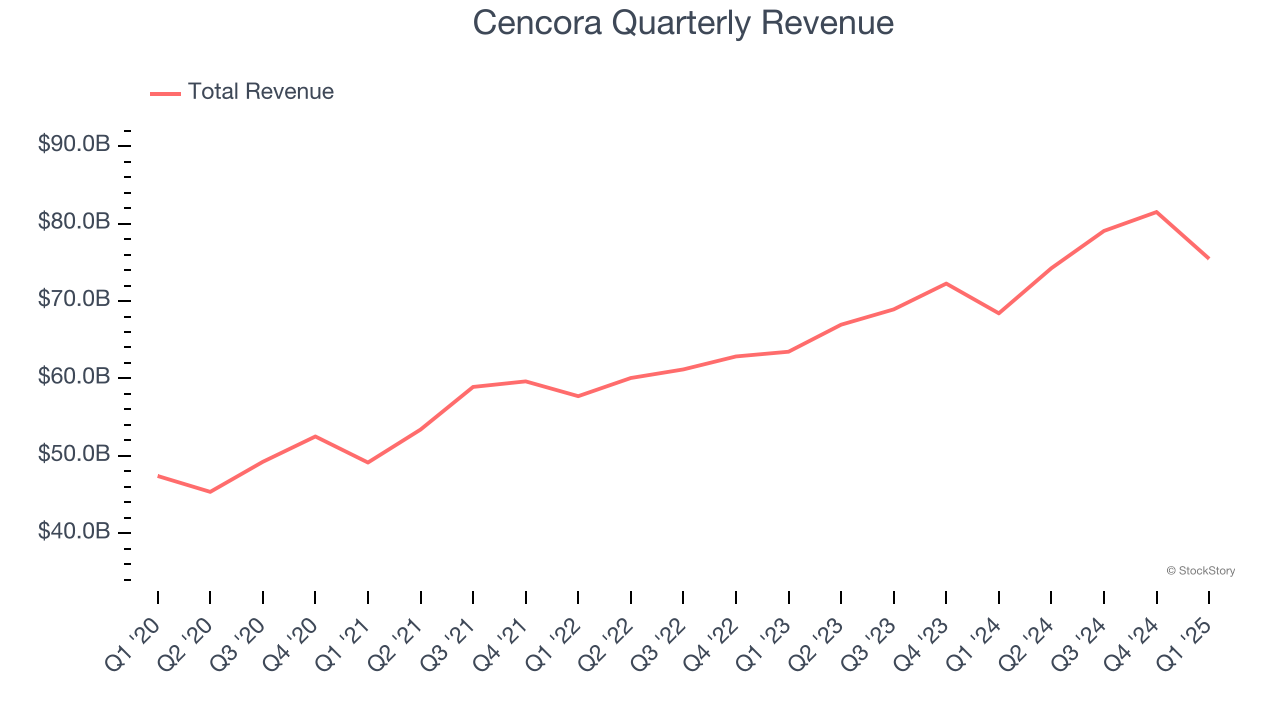
This quarter, Cencora’s year-on-year revenue growth was 10.3%, and its $75.45 billion of revenue was in line with Wall Street’s estimates.
Looking ahead, sell-side analysts expect revenue to grow 7.6% over the next 12 months, a deceleration versus the last two years. We still think its growth trajectory is satisfactory given its scale and suggests the market is forecasting success for its products and services.
Software is eating the world and there is virtually no industry left that has been untouched by it. That drives increasing demand for tools helping software developers do their jobs, whether it be monitoring critical cloud infrastructure, integrating audio and video functionality, or ensuring smooth content streaming. Click here to access a free report on our 3 favorite stocks to play this generational megatrend.
Operating Margin
Cencora was roughly breakeven when averaging the last five years of quarterly operating profits, lousy for a healthcare business.
On the plus side, Cencora’s operating margin rose by 3.1 percentage points over the last five years, as its sales growth gave it operating leverage. This performance was mostly driven by its past improvements as the company’s margin was relatively unchanged on two-year basis.
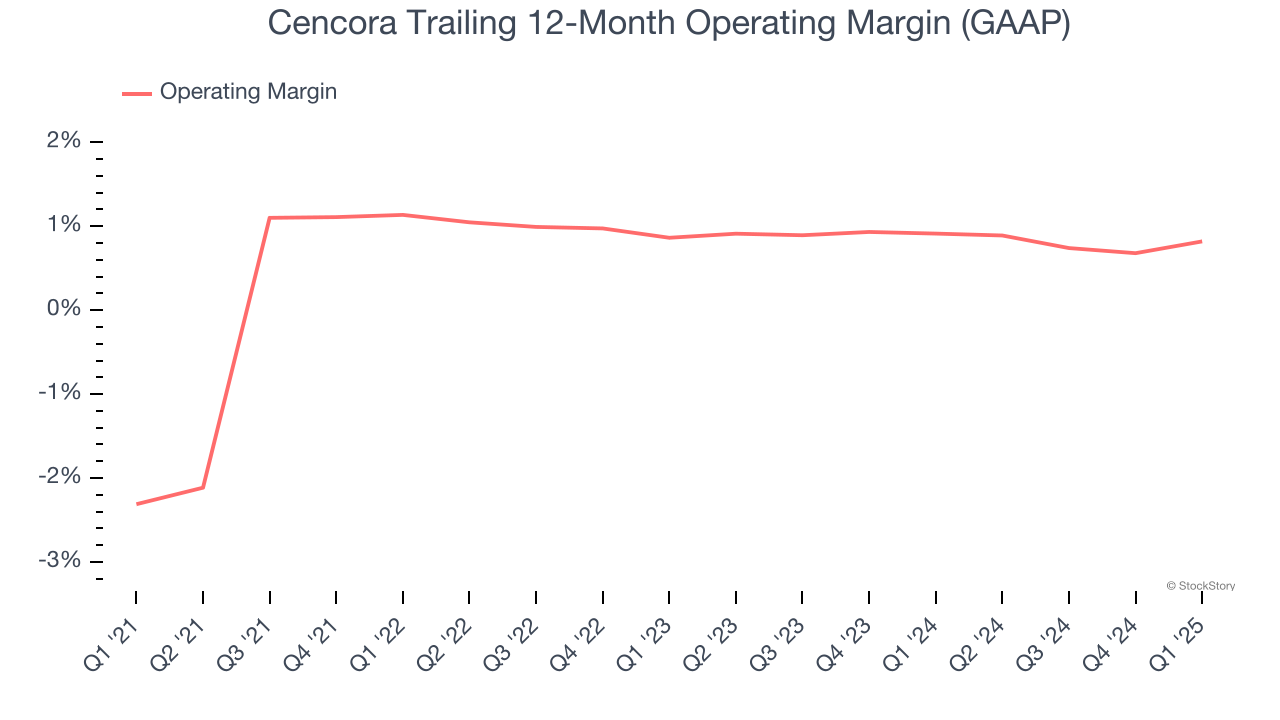
This quarter, Cencora generated an operating profit margin of 1.4%, in line with the same quarter last year. This indicates the company’s overall cost structure has been relatively stable.
Earnings Per Share
Revenue trends explain a company’s historical growth, but the long-term change in earnings per share (EPS) points to the profitability of that growth – for example, a company could inflate its sales through excessive spending on advertising and promotions.
Cencora’s EPS grew at a spectacular 14.5% compounded annual growth rate over the last five years, higher than its 10.8% annualized revenue growth. This tells us the company became more profitable on a per-share basis as it expanded.
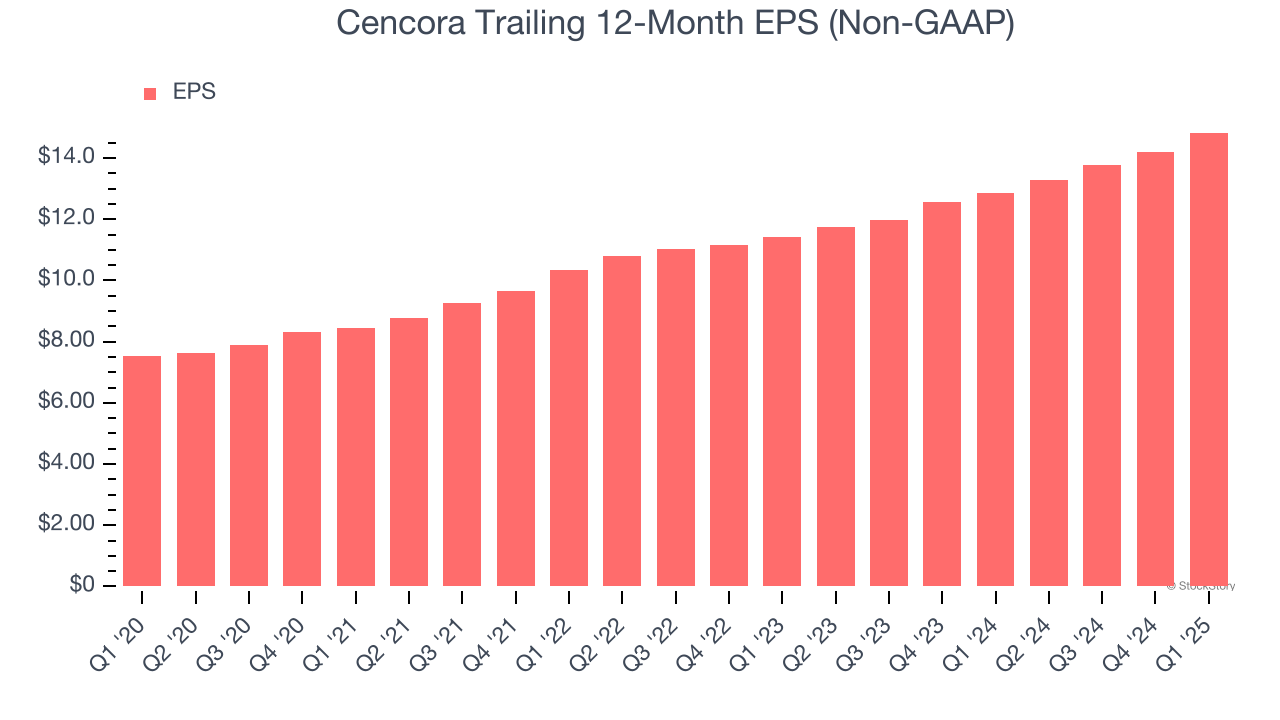
We can take a deeper look into Cencora’s earnings quality to better understand the drivers of its performance. As we mentioned earlier, Cencora’s operating margin was flat this quarter but expanded by 3.1 percentage points over the last five years. On top of that, its share count shrank by 5.8%. These are positive signs for shareholders because improving profitability and share buybacks turbocharge EPS growth relative to revenue growth. 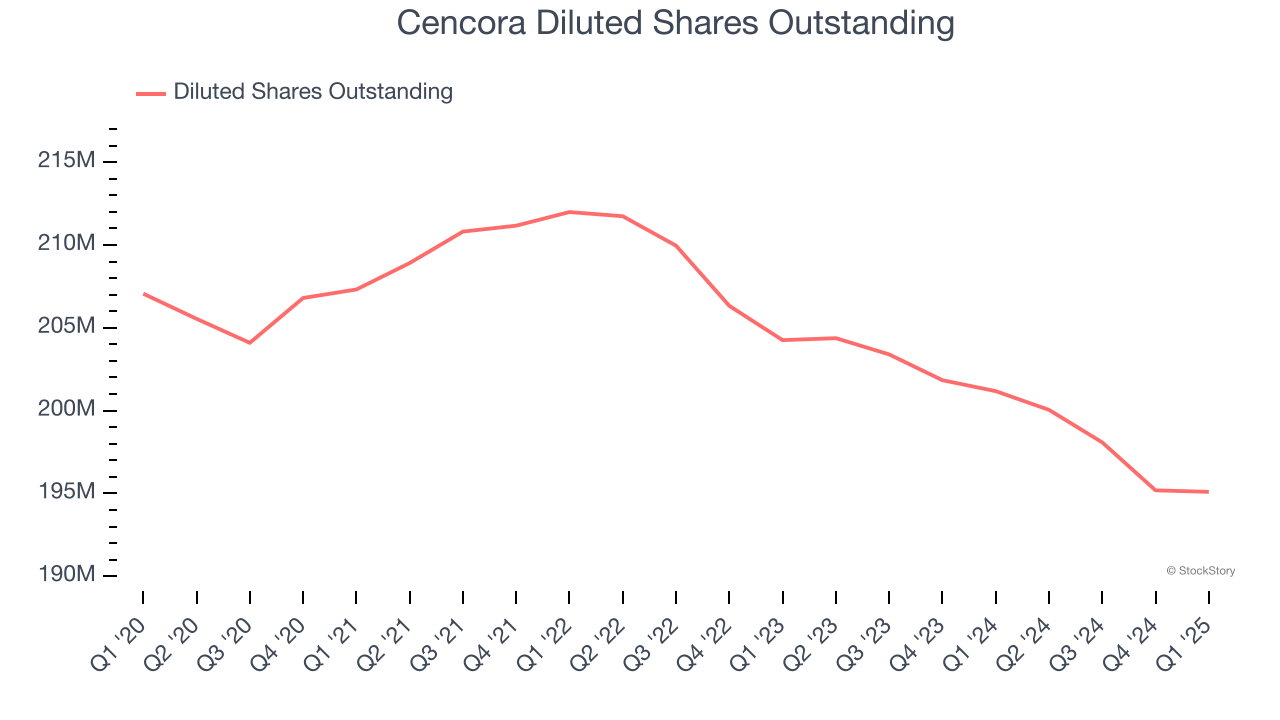
In Q1, Cencora reported EPS at $4.42, up from $3.80 in the same quarter last year. This print beat analysts’ estimates by 7.9%. Over the next 12 months, Wall Street expects Cencora’s full-year EPS of $14.83 to grow 9.2%.
Key Takeaways from Cencora’s Q1 Results
Even though revenue was just in line, Cencora beat EPS expectations and raised full-year EPS guidance to a level above Wall Street's estimates. Zooming out, we think this was a solid quarter. The stock remained flat at $292.01 immediately following the results.
Is Cencora an attractive investment opportunity at the current price? When making that decision, it’s important to consider its valuation, business qualities, as well as what has happened in the latest quarter. We cover that in our actionable full research report which you can read here, it’s free.


