
J. M. Smucker currently trades at $108.53 per share and has shown little upside over the past six months, posting a small loss of 3.5%. The stock also fell short of the S&P 500’s 17.2% gain during that period.
Is there a buying opportunity in J. M. Smucker, or does it present a risk to your portfolio? Get the full stock story straight from our expert analysts, it’s free for active Edge members.
Why Do We Think J. M. Smucker Will Underperform?
We're cautious about J. M. Smucker. Here are three reasons you should be careful with SJM and a stock we'd rather own.
1. Slow Organic Growth Suggests Waning Demand In Core Business
When analyzing revenue growth, we care most about organic revenue growth. This metric captures a business’s performance excluding one-time events such as mergers, acquisitions, and divestitures as well as foreign currency fluctuations.
The demand for J. M. Smucker’s products has been stable over the last eight quarters but fell behind the broader sector. On average, the company has posted feeble year-on-year organic revenue growth of 2.3%. 
2. Shrinking Operating Margin
Operating margin is a key measure of profitability. Think of it as net income - the bottom line - excluding the impact of taxes and interest on debt, which are less connected to business fundamentals.
Analyzing the trend in its profitability, J. M. Smucker’s operating margin decreased by 27.1 percentage points over the last year. This raises questions about the company’s expense base because its revenue growth should have given it leverage on its fixed costs, resulting in better economies of scale and profitability. J. M. Smucker’s performance was poor no matter how you look at it - it shows that costs were rising and it couldn’t pass them onto its customers. Its operating margin for the trailing 12 months was negative 11.2%.

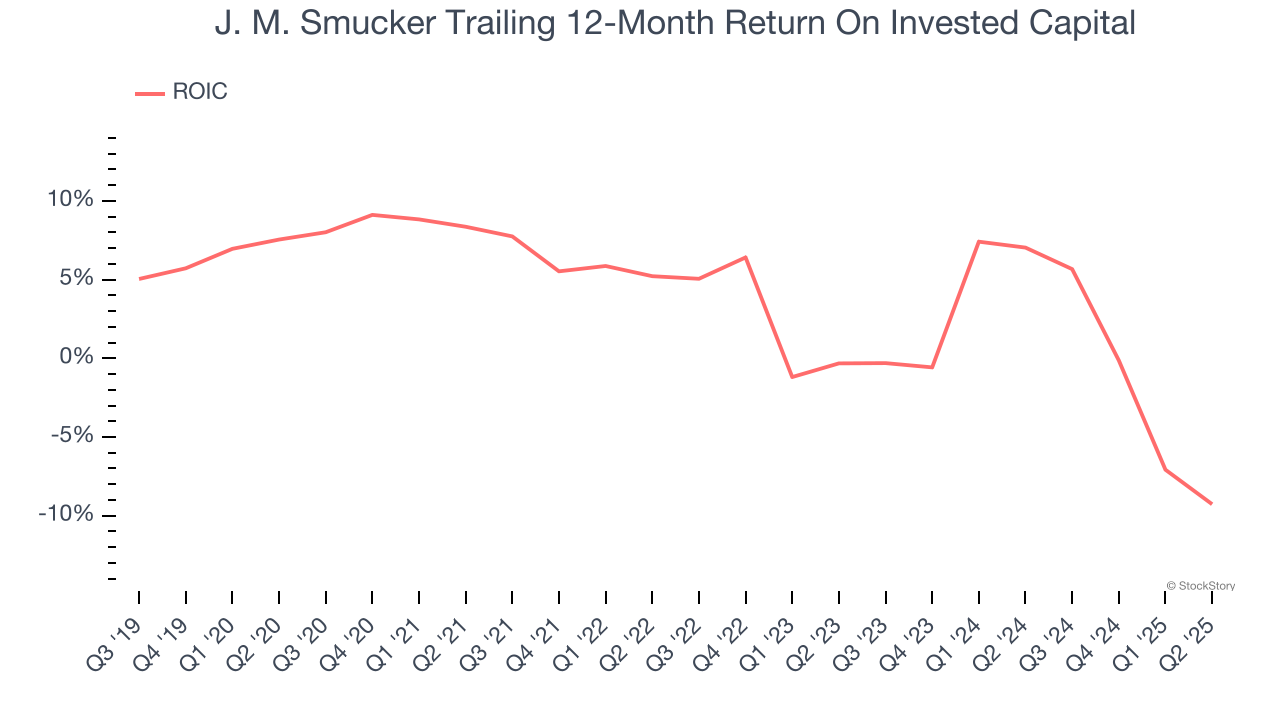
3. Previous Growth Initiatives Haven’t Impressed
Growth gives us insight into a company’s long-term potential, but how capital-efficient was that growth? Enter ROIC, a metric showing how much operating profit a company generates relative to the money it has raised (debt and equity).
J. M. Smucker historically did a mediocre job investing in profitable growth initiatives. Its five-year average ROIC was 2.2%, lower than the typical cost of capital (how much it costs to raise money) for consumer staples companies.
Final Judgment
We cheer for all companies serving everyday consumers, but in the case of J. M. Smucker, we’ll be cheering from the sidelines. With its shares lagging the market recently, the stock trades at 11.5× forward P/E (or $108.53 per share). While this valuation is reasonable, we don’t see a big opportunity at the moment. There are better stocks to buy right now. We’d recommend looking at one of our top digital advertising picks.
Stocks We Like More Than J. M. Smucker
Trump’s April 2025 tariff bombshell triggered a massive market selloff, but stocks have since staged an impressive recovery, leaving those who panic sold on the sidelines.
Take advantage of the rebound by checking out our Top 9 Market-Beating Stocks. This is a curated list of our High Quality stocks that have generated a market-beating return of 183% over the last five years (as of March 31st 2025).
Stocks that made our list in 2020 include now familiar names such as Nvidia (+1,545% between March 2020 and March 2025) as well as under-the-radar businesses like the once-small-cap company Comfort Systems (+782% five-year return). Find your next big winner with StockStory today.
StockStory is growing and hiring equity analyst and marketing roles. Are you a 0 to 1 builder passionate about the markets and AI? See the open roles here.


