All amounts are in United States dollars, unless otherwise stated.
TORONTO, June 23, 2025 (GLOBE NEWSWIRE) -- Alamos Gold Inc. (TSX:AGI; NYSE: AGI) (“Alamos” or the “Company”) today reported results of the Base Case Life of Mine Plan (“Base Case LOM Plan”) completed on the Island Gold District operation, located in Ontario, Canada. The Base Case LOM Plan integrates Island Gold and Magino as one consolidated long-life operation that is expected to become one of the largest, lowest-cost, and most profitable gold mines in Canada. An Expansion Study is expected to be released in the fourth quarter of 2025 detailing the significant upside potential within the Island Gold District beyond the Base Case LOM Plan.
The Base Case LOM Plan has been updated to reflect the current costing environment, significant growth in Mineral Reserves at Island Gold, operating savings resulting from the use of a larger and more efficient Magino mill, and scope changes since the Phase 3+ Expansion Study (“Phase 3+ Study”), which was completed in 2022. The Base Case LOM Plan includes Mineral Reserves only at Island Gold and Magino. Both deposits have significant Measured, Indicated and Inferred Mineral Resources, which have not been factored into the Base Case LOM Plan and economic analysis. All amounts are in United States dollars, unless otherwise stated.
“The Base Case Plan for the Island Gold District outlines an attractive, long-life operation that is expected to become one of Canada’s largest, lowest-cost, and most profitable gold mines. This is a first look at an operation with significant upside potential which we expect to detail in an Expansion Study later this year. We expect this to include a larger Mineral Reserve through ongoing Mineral Resource conversion, and a potential further expansion up to 20,000 tonnes per day, supporting an even larger, more valuable, and profitable operation. Longer-term, we see excellent opportunities for that value to continue to grow through ongoing exploration success at Island Gold, and a number of emerging higher-grade regional targets that have the potential to support multiple sources of ore within an expanded mill,” said John A. McCluskey, President and Chief Executive Officer.
Base Case LOM Plan Highlights:
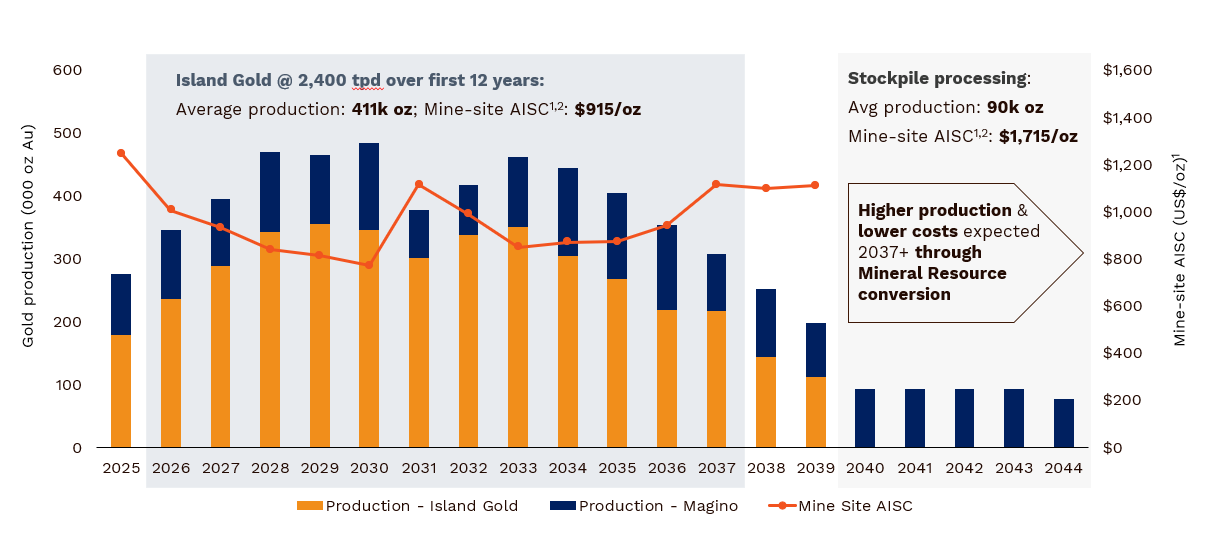
Average annual gold production of 411,000 ounces starting in 2026 and over the initial 12 years, a 43% increase from the mid-point of 2025 production guidance driven by the completion of the Phase 3+ Expansion
- Average annual production of 306,000 ounces over the 20-year Mineral Reserve life
- Significant upside potential through a further expansion of the operation, and the expected conversion of a significant portion of the large Mineral Resource base to Mineral Reserves through ongoing delineation drilling
Low-cost structure: average mine-site all-in sustaining costs (“mine-site AISC”) of $915 per ounce over the initial 12 years (2026+), a 19% decrease from the mid-point of 2025 guidance
- Average total cash costs of $581 per ounce over the initial 12 years (average $699 per ounce over the life of mine)
- Average AISC of $1,003 per ounce over the life of mine, an 11% decrease from 2025 guidance
Long-life operation supported by a large and growing Mineral Reserve base
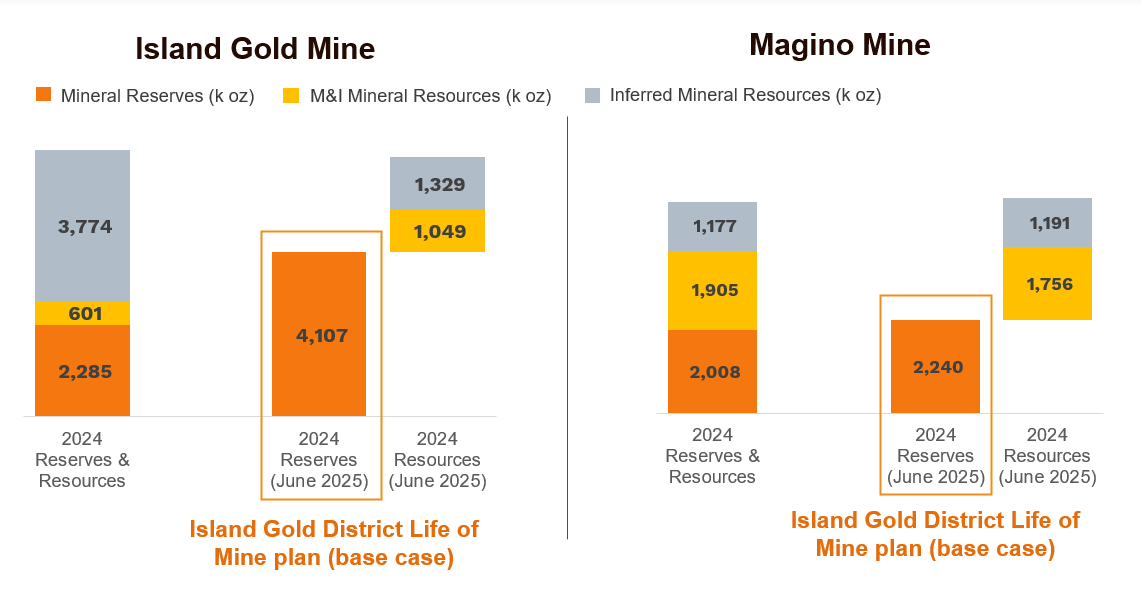
- 48% increase in total Mineral Reserves to 6.3 million ounces (88.6 million tonnes (“mt”) grading 2.23 grams per tonne (“g/t Au”), including:
- 4.1 million ounces grading 10.85 g/t Au (11.8 mt) at Island Gold underground, up 80% from the end of 2024 reflecting the conversion of Mineral Resources
- 2.2 million ounces grading 0.91 g/t Au (76.9 mt) at Magino open pit, up 12% from the end of 2024
Significant upside potential expected to be outlined in an Expansion Study in the fourth quarter of 2025
- Base Case LOM Plan based only on Mineral Reserves and long-term milling rates of 12,400 tonnes per day (“tpd”)
- Expansion Study expected to include an increase in milling rates potentially to between 18,000 and 20,000 tpd supporting higher throughput rates from both Island Gold and Magino, and
- The incorporation of a larger Mineral Reserve through the expected conversion of a significant portion of existing Mineral Resources, which consist of:
- Island Gold Underground
- M&I Mineral Resources: 1.0M oz grading 10.49 g/t Au (3.1 mt)
- Inferred Mineral Resources: 1.3M oz grading 16.88 g/t Au (2.4 mt)
- Magino Open Pit
- M&I Mineral Resources: 1.8M oz grading 0.91 g/t Au (60.3 mt)
- Inferred Mineral Resources: 1.2M oz grading 0.92 g/t Au (40.3 mt)
- Island Gold Underground
Low capital intensity
- Growth capital of $453 million with the majority to be spent over the next two years, focused on completing the Phase 3+ Expansion and Magino mill expansion to 12,400 tpd
- Sustaining capital of $1,808 million over the life of mine, or $304 per ounce
- Sustaining capital intensity expected to decrease within Expansion Study reflecting a larger Mineral Reserve leveraging existing infrastructure
- Total all-in cost of $1,079 per ounce, including total capital intensity of $380 per ounce
Attractive base case economics with significant upside
- After-tax net present value (“NPV”) (5%) of $4.5 billion, (base case long-term gold price assumption of $2,400 per ounce and USD/CAD foreign exchange rate of $0.75:1)
- After-tax NPV (5%) of $6.7 billion, at current gold prices of approximately $3,300 per ounce
- Expansion Study is expected to demonstrate attractive economics with a further increase in value reflecting a larger Mineral Reserve and higher throughput rates
Phase 3+ Expansion expected to be completed during the second half of 2026
- Base Case LOM Plan is consistent with existing three-year production guidance
- The slight delay in the completion of the Phase 3+ Expansion (from the first half of 2026 previously) is not expected to impact production or cost guidance in 2026 and 2027
- Work on the Phase 3+ Expansion has been largely de-risked with a number of key projects substantially complete including the shaft surface infrastructure, and shaft development which is currently at 92% of its ultimate planned depth
Low and decreasing Greenhouse Gas (“GHG”) emission intensity
- 29% reduction of GHG emissions per ounce from already low levels which are currently 57% below the industry average. This is expected to be achieved through the completion of the Phase 3+ Expansion, and connection of the Magino mill to grid power in 2026
Fully funded growth: ongoing free cash flow with significant growth expected in 2026
- Island Gold District is expected to self finance all remaining growth capital at current gold prices with significant free cash flow growth following the completion of the Phase 3+ Expansion in 2026
| Base Case LOM Plan Highlights | |
| Production | |
| Mine life (years) | 20 |
| Phase 3+ Expansion completion date | H2 2026 |
| Total gold production (000 ounces) | 6,112 |
| Average annual gold production – 12-year average, 2026+ (000 ounces) | 411 |
| Average annual gold production – life of mine (000 ounces) | 306 |
| Total mill feed (000 tonnes) | 88,648 |
| Average mill throughput – 2027+ (tpd) | 12,400 |
| Average gold grade (g/t Au) | 2.23 |
| Average Island Gold ore throughput – 2027+ (tpd) | 2,400 |
| Average Island Gold ore grade milled (g/t Au) | 10.85 |
| Average Magino ore throughput (tpd) | 10,000 |
| Average Magino ore grade milled (g/t Au) | 0.91 |
| Average recovery (%) | 96.3% |
| Operating Costs | |
| Open pit mining cost (C$/tonne of total material mined) | $4.24 |
| Underground mining cost (C$/tonne of ore mined) | $124 |
| Processing cost (C$/tonne of ore milled) | $16.74 |
| G&A cost (C$/tonne of ore milled) | $13.73 |
| Total cash cost – 12-year average, 2026+ (per ounce sold)1,2 | $581 |
| Total cash cost – life of mine (per ounce sold)1,2 | $699 |
| Mine-site all-in sustaining cost – 12-year average, 2026+ (per ounce sold)1,2 | $915 |
| Mine-site all-in sustaining cost – life of mine (per ounce sold)1,2 | $1,003 |
| Capital Costs (millions) | |
| Growth capital expenditure | $453 |
| Sustaining capital expenditure5 | $1,808 |
| Total capital expenditure – life of mine | $2,261 |
| Total capital expenditure (per ounce sold) – life of mine2 | $380 |
| Total all-in cost (per ounce sold) – life of mine2,3 | $1,079 |
| Base Case Economic Analysis: $2,400 per ounce Gold Price (USD/CAD foreign exchange rate of $0.75:1)4 | |
| NPV @ 0% discount rate (millions, after-tax) | $6,417 |
| NPV @ 5% discount rate (millions, after-tax) | $4,477 |
| Economic Analysis at $3,300 per ounce Gold Price (USD/CAD foreign exchange rate of $0.75:1) | |
| NPV @ 0% discount rate (millions, after-tax) | $9,682 |
| NPV @ 5% discount rate (millions, after-tax) | $6,667 |
- Total cash costs and mine-site all-in sustaining costs include royalties and silver as a by-product credit
- Please refer to the Cautionary Notes on non-GAAP Measures and Additional GAAP Measures
- Total all-in cost per ounce sold is calculated as total cash cost per ounce plus total capital per ounce sold over the life of mine
- The Base Case LOM Plan includes a gold price of $3,000/oz in 2025 through to 2027, and a long-term (2028+) gold price of $2,400/oz, as well as a USD/CAD foreign exchange rate of $0.73:1 in 2025, $0.74:1 in 2026 and 2027, and $0.75:1 from 2028 onwards
- Sustaining capital includes reclamation and capital leases
Prior Disclosure Regarding Island Gold Mine
As a result of a review by staff of the Ontario Securities Commission, the Company is providing the following corrective information regarding its disclosure with respect to the Island Gold Mine.
The 2025 Base Case Island Gold District Technical Report is being prepared and will be disclosed without the inclusion of Inferred Mineral Resources in economic analyses, including production schedules, mine life and cash flow models. The 2025 Base Case Island Gold District Technical Report will supersede any prior technical reports published by Alamos with respect to the Island Gold Mine.
Prior public disclosure regarding the Island Gold Mine included the use of Inferred Mineral Resources in economic analyses, including production schedules, mine life and cash flow models. Such disclosure was prohibited under paragraph 2.3(1)(b) of National Instrument 43-101 Standards of Disclosure for Mineral Projects (NI 43-101), which restricts public disclosure of the results of an economic analysis that includes or is based on Inferred Mineral Resources. In addition, NI 43-101 incorporates by reference the CIM Definition Standards (2014), which states that Inferred Mineral Resources must not be included in the economic analysis, production schedules, or estimated mine life in publicly disclosed prefeasibility or feasibility studies, or in the life of mine plans and cash flow models of developed mines. Inferred Mineral Resources are considered too speculative geologically to have economic considerations applied to them that would enable them to be categorized as Mineral Reserves and there can be no certainty that the results of an economic analysis including Inferred Mineral Resources would be realized.
Mineral Reserves and Resources
An updated Proven and Probable Mineral Reserve totaling 88.6 mt, grading 2.23 g/t Au, containing 6.3 million ounces of gold has been included in the Base Case LOM Plan. This represents a 48% increase from the 4.3 million ounces reported at the end of 2024, reflecting the conversion of Measured, Indicated and Inferred Mineral Resources at Island Gold and Magino. Only Mineral Reserves have been incorporated into the Base Case LOM plan and economic analysis.
Island Gold’s updated Mineral Reserve increased by 80% to 4.1 million ounces, driven by Mineral Resource conversion. An updated classification methodology has been adopted based on definition drilling, extensive historical and current production data, reconciliation, and underground mapping, which demonstrates that Indicated Mineral Resource continuity can be reliably established with an average drill spacing of 40 metres, versus 25 metres previously. This contributed to the conversion of a portion of the large Inferred Mineral Resource to Measured & Indicated Mineral Resources, which was subsequently converted to Mineral Reserves.
Mineral Reserves – Effective as of December 31, 2024
| Proven and Probable Gold Mineral Reserves | |||||||||
| June 2025 Update | February 2025 Update | % Change | |||||||
| | Tonnes | Grade | Ounces | Tonnes | Grade | Ounces | Tonnes | Grade | Ounces |
| (000’s) | (g/t Au) | (000’s) | (000’s) | (g/t Au) | (000’s) | (000’s) | (g/t Au) | (000’s) | |
| Island Gold | |||||||||
| Proven | 821 | 11.82 | 312 | 727 | 12.74 | 298 | 18% | -11% | 5% |
| Probable | 10,947 | 10.78 | 3,795 | 5,505 | 11.23 | 1,987 | 112% | -10% | 91% |
| Proven and Probable | 11,769 | 10.85 | 4,107 | 6,232 | 11.40 | 2,285 | 89% | -5% | 80% |
| Magino | |||||||||
| Proven | 22,163 | 0.88 | 626 | 19,684 | 0.89 | 561 | 13% | -1% | 12% |
| Probable | 54,710 | 0.92 | 1,613 | 48,715 | 0.92 | 1,447 | 12% | 0% | 11% |
| Proven and Probable | 76,873 | 0.91 | 2,240 | 68,400 | 0.91 | 2,008 | 12% | 0% | 12% |
| Island Gold District | |||||||||
| Proven | 22,984 | 1.27 | 938 | 20,411 | 1.31 | 859 | 13% | -4% | 9% |
| Probable | 65,657 | 2.56 | 5,408 | 54,220 | 1.97 | 3,434 | 22% | 28% | 57% |
| Proven and Probable | 88,642 | 2.23 | 6,347 | 74,632 | 1.79 | 4,293 | 19% | 25% | 48% |
- Mineral Reserves reported are consistent with the CIM Definition Standards for Mineral Resources and Mineral Reserves
- Mineral Reserves are reported to a cut-off grade of 3.78 Au g/t at Island Gold and 0.30 Au g/t for Magino
- The cut-off grades are based on a gold price of $1,600/oz Au at both Island Gold and Magino
- Silver is not used in the cut-off grade calculation
- Totals may not add up due to rounding
- Chris Bostwick, FAusIMM, Senior Vice President, Technical Services is the Qualified Person for Magino’s Mineral Reserve estimate. Mr. Bostwick is a Qualified Person within the meaning of Canadian Securities Administrator's National Instrument 43-101 ("NI 43-101")
- Nathan Bourgeault, P.Eng., Manager, Technical Services for the Island Gold District is the Qualified Person for Island Gold’s Mineral Reserve estimate. Mr. Bourgeault is a Qualified Person within the meaning of Canadian Securities Administrator's National Instrument 43-101 ("NI 43-101")
Mineral Resources for Island Gold and Magino, as detailed below, have not been included in the Base Case LOM Plan and represent potential upside. A significant portion of Mineral Resources at Island Gold, and Measured and Indicated Mineral Resources at Magino, are expected to be converted to Reserves and incorporated into the Expansion Study to be released in the fourth quarter of 2025. The decrease in Inferred Mineral Resources at Island Gold reflects the conversion to Measured and Indicated Mineral Resources and Mineral Reserves.
The Mineral Resource conversion rate to Reserves at Island Gold continues to average more than 90%. This high rate of conversion is expected to continue based on ongoing success with the delineation drilling program.
Mineral Resources – Effective as of December 31, 2024
| Measured and Indicated Gold Mineral Resources (exclusive of Mineral Reserves) | |||||||||||
| June 2025 Update | February 2025 Update | % Change | |||||||||
| | Tonnes | Grade | Ounces | Tonnes | Grade | Ounces | Tonnes | Grade | Ounces | ||
| (000’s) | (g/t Au) | (000’s) | (000’s) | (g/t Au) | (000’s) | (000’s) | (g/t Au) | (000’s) | |||
| Island Gold | |||||||||||
| Measured | 470 | 14.66 | 222 | 235 | 10.96 | 83 | 100% | 34% | 167% | ||
| Indicated | 2,640 | 9.75 | 827 | 1,898 | 8.49 | 518 | 39% | 15% | 60% | ||
| Measured and Indicated | 3,110 | 10.49 | 1,049 | 2,113 | 8.76 | 601 | 47% | 20% | 75% | ||
| Magino | |||||||||||
| Measured | 5,061 | 0.87 | 141 | 5,579 | 1.00 | 179 | -9% | -13% | -21% | ||
| Indicated | 55,209 | 0.91 | 1,615 | 57,110 | 0.94 | 1,726 | -3% | -3% | -6% | ||
| Measured and Indicated | 60,270 | 0.91 | 1,756 | 62,689 | 0.94 | 1,905 | -4% | -3% | -8% | ||
| Island Gold District | |||||||||||
| Measured | 5,531 | 2.04 | 363 | 5,814 | 1.40 | 262 | -5% | 46% | 39% | ||
| Indicated | 57,849 | 1.31 | 2442 | 59,008 | 1.18 | 2,244 | -2% | 11% | 9% | ||
| Measured and indicated | 63,380 | 1.38 | 2,805 | 64,802 | 1.20 | 2,506 | -2% | 14% | 12% | ||
| Inferred Gold Mineral Resources (exclusive of Mineral Reserves) | |||||||||||
| Island Gold | 2,449 | 16.88 | 1,329 | 7,106 | 16.52 | 3,774 | -66% | 2% | -65% | ||
| Magino | 40,291 | 0.92 | 1,191 | 40,383 | 0.91 | 1,177 | 0% | 1% | 1% | ||
| Island Gold District | 42,740 | 1.83 | 2,520 | 47,489 | 3.24 | 4,951 | -10% | -44% | -49% | ||
- Mineral Resources reported are consistent with the CIM Definition Standards for Mineral Resources and Mineral Reserves
- Mineral Resources are reported at an assumed gold price of $1,800/oz
- Mineral Resources are not Mineral Reserves and do not have demonstrated economic viability. There is no certainty that all or any part of the Mineral Resources estimated will be converted into Mineral Reserves
- Island Gold underground Resources are estimated at a cut-off grade of 3.36 g/t
- Magino open pit Resources are estimated at a cut-off grade of 0.28 g/t Au
- Contained Au ounces are in-situ and do not include metallurgical recovery losses
- Mineral Resources are exclusive of Mineral Reserves
- Totals may not add up due to rounding
- Jeffrey Volk, CPG, FAusIMM, Director of Reserves and Resources for Alamos Gold Inc is the Qualified Person for the Magino open pit Mineral Resource estimate. Tyler Poulin, P. Geo., Geology Superintendent for Alamos Gold , is the Qualified Person for the Island Gold underground Mineral Resource estimate. Mr. Volk and Mr. Poulin are Qualified Persons within the meaning of Canadian Securities Administrator's National Instrument 43-101 ("NI 43-101")
Economic Analysis
The Base Case LOM Plan has an estimated base case after-tax NPV (5%) of $4.5 billion assuming a long-term gold price of $2,400 per ounce and USD/CAD foreign exchange rate of $0.75:1.
Assuming a $3,300 per ounce gold price, the after-tax NPV (5%) increases to $6.7 billion. The mine plan, operating parameters and capital estimates incorporated in the Base Case LOM Plan are effective as the first quarter of 2025. The project economics are sensitive to metal price assumptions and input costs as detailed in the tables below.
Island Gold District: Base Case LOM Plan After-Tax NPV (5%) Sensitivity ($ Millions)
| -10% | -5% | Base Case | 5% | 10% | |
| Gold Price | $3,337 | $3,897 | $4,477 | $5,080 | $5,704 |
| Canadian Dollar | $4,752 | $4,616 | $4,477 | $4,339 | $4,198 |
| Capital Costs | $4,552 | $4,514 | $4,477 | $4,440 | $4,403 |
| Operating Costs | $4,722 | $4,600 | $4,477 | $4,355 | $4,232 |
Island Gold District: Base Case LOM Plan After-Tax NPV (5%) Sensitivity to Gold Price
| Gold Price ($/oz) | After-Tax NPV5% ($M) |
| $2,000 | $2,942 |
| $2,400 (Base Case1) | $4,477 |
| $2,750 | $5,098 |
| $3,000 | $5,811 |
| $3,300 | $6,667 |
| $3,500 | $7,236 |
- Base case includes a gold price of $3,000/oz in 2025 through to 2027, and a long-term (2028+) gold price of $2,400/oz
Base Case LOM Plan Overview
The Island Gold District is comprised of the Island Gold underground mine and the Magino open pit mine. Both operations will utilize the centralized Magino mill for processing ore and the Magino tailings management facility for tailings storage.
Underground ore from Island Gold is currently being processed through the Island Gold mill. During the third quarter of 2025, the Company expects to shut down the Island Gold mill and transition to processing both Island Gold and Magino ore through the Magino mill at a rate of approximately 11,200 tpd.
The Phase 3+ Expansion of Island Gold is expected to double underground mining rates to 2,400 tpd through the addition of a shaft and paste plant. Following completion of the expansion in 2026, underground mining will transition from trucking ore and waste to skipping ore and waste to surface, through the new shaft infrastructure. This is expected to drive production higher and costs significantly lower. The Magino mill will be expanded to 12,400 tpd to accommodate the increased production rates from Island Gold of 2,400 tpd, with the remaining 10,000 tpd coming from the Magino open pit.
The Phase 3+ Expansion is expected to be completed during the second half of 2026, a slight delay from initial guidance of the first half of 2026 in the Phase 3+ Study, though this is not expected to impact current production and cost guidance for the Island Gold District in 2026 and 2027.
Base Case LOM Production and Mine-site AISC Profile
- Please refer to Cautionary Notes on non-GAAP Measures and Additional GAAP Measures
- For the purposes of calculating all-in sustaining costs at individual mine sites, the Company does not include corporate and administrative and corporate share-based compensation expenses
Phase 3+ Expansion Significantly De-Risked
The Phase 3+ Expansion of Island Gold underground has been significantly de-risked given the progress achieved to date, with details as follows:
- Shaft surface infrastructure is now substantially complete, including the headframe, hoist house and warehouse. The bin house has been erected and is currently being mechanically and electrically outfitted. The electrical infrastructure required for shaft development was completed in late 2023
- Shaft development is down to a depth of 1,265 metres, 92% of the ultimate planned depth of 1,379 metres
- Construction of the paste plant is 71% complete, and is expected to be fully completed by the end of 2025
- The 115kV powerline project is on track for completion by mid-2026. The power line will supply additional grid power sufficient to power the entire operation through lower cost power from the electric grid
- As a brownfield expansion of an existing operating mine, and with 76% of the growth capital spent or committed as of the end of May, the project is significantly de-risked. The shaft is expected to begin skipping ore from underground in the second half of 2026
Mining
Island Gold underground
Longitudinal long-hole open stoping will continue to be utilized as the primary mining method with the completion of the shaft and paste plant supporting the increase in mining rates to 2,400 tpd. Given the ongoing growth of the ore body, and as mining progresses deeper, a more geotechnically sound approach will be employed across the stope sequence with mining moving from the centre towards sill extremities (versus from the sill extremities towards the centre currently). The new approach will require increased underground development which will support an improved geotechnical mining sequence and a better managed stress environment, as well as potential increased mining rates of greater than 2,400 tpd as part of a longer-term expansion scenario.
Magino open pit
The Magino open pit will continue to be mined with a conventional shovel-truck methodology. Total mining rates of ore and waste are expected to average 66,400 tpd. Mining rates of ore are expected to average 14,100 tpd over the initial 14 years, with 10,000 tpd to be processed through the Magino mill, and the remaining lower grade ore to be stockpiled for processing at the end of the mine life. The waste to ore ratio mined over the life of mine is expected to average 3.7:1.
Shaft
The main components of the shaft infrastructure are unchanged from the Phase 3+ Study with the exception of the crushing facility, which will be installed underground rather than at surface. This change optimizes the flow of ore handling from underground to the mill and reduces the maintenance required for the hoisting system.
A 5.0 metre diameter concrete lined shaft is being constructed with a steel head frame. The skip size has been increased from 12 tonnes in the Phase 3+ Study to 15 tonnes, which will increase the hoisting capacity to 5,500 tpd at the current planned depth of 1,379 metres. This has increased from 4,500 tpd in the Phase 3+ Study and is more than sufficient to accommodate peak mining rates of 4,300 tpd (ore & waste). The shaft will have dedicated compartments for ore and waste movement, and a double-deck service cage for the transport of personnel and materials. The hoisting plant is designed for an ultimate depth of 2,000 metres providing flexibility to accommodate future exploration success.
The underground ore and waste handling and loading pocket will be a conventional configuration similar to that at Young-Davidson. Once skipped to surface, crushed ore will be trucked to the expanded Magino mill.
Paste plant
As outlined in the Phase 3+ Study, a paste plant and underground paste distribution system is being constructed. This will allow for faster stope cycling, thereby supporting higher underground mining rates and providing increased geotechnical stability. It will also increase mining recovery resulting in an additional 140,000 ounces of gold recovered over the life of mine. Further, 65% of tailings will be placed underground reducing tailings dam raise requirements over the mine life.
Mobile fleet – Island Gold
Underground mining rates are expected to ramp up from current rates of 1,200 to 1,400 tpd by the end of 2025. Mining rates are expected to further increase to design rates of 2,400 tpd by the end of 2026, driven by the completion of the Phase 3+ Expansion. This will be supported by a significantly smaller truck fleet than required under the current ramp operation.
Post completion of the shaft, a total of seven haul trucks will be required to support a mining rate of 2,400 tpd, compared to a peak of 20 haul trucks required to sustain ramp haulage at 1,200 tpd. This will contribute to the lower ventilation requirements, significantly lower diesel usage, and lower costs given the productivity improvements and economies of scale.
Mobile fleet – Magino
The fleet at Magino consists of 15 haul trucks with a payload capacity of 139 tonnes, combined with three diesel powered hydraulic shovels and one excavator, supported by three front-end loaders. The current mobile fleet can support peak mining rates of 74,000 tpd of ore and waste.
Decreasing GHG emission intensity
The completion of the Phase 3+ Expansion is expected to reduce the Island Gold District GHG emissions intensity from already low levels. In 2024, the Island Gold District emission intensity was 57% lower than the industry average. The transition to a shaft operation from hauling ore to surface, and fully connecting the Magino mill to the electric grid, is expected to drive a further 29% decrease in GHG emissions per ounce produced. This will represent an emission intensity 70% lower than the industry average.
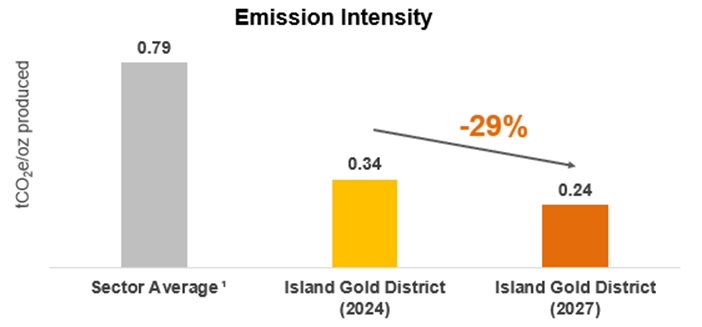
- Source: S&P Global – Primary Gold GHG Emissions Intensities Decline – December 10, 2024
Processing and Infrastructure
The Base Case LOM Plan reflects the use of the larger centralized mill and tailings facility at Magino. With ore from Island Gold underground to be processed at lower operating costs through the larger Magino mill starting in 2025, the current Island Gold mill and tailings facility will no longer be required.
Current Magino Mill Design
The Magino mill includes a crushing circuit that consists of a primary jaw crusher and a secondary cone crusher followed by a semi-autogenous (SAG) mill and ball mill. A cyclone separates the feed sending it to either a gravity circuit where course gold is removed or pumped to the leach circuit where it is thickened and oxygen, lime and cyanide are added for cyanidation. The carbon-in-pulp (CIP) circuit recovers the dissolved gold from the leached slurry.
The gravity concentrate is processed via an intensive leach reactor. Loaded carbon is acid washed and then undergoes carbon stripping to recover the gold through electrowinning and smelting with the final product being gold doré.
Two successful batch tests of Island Gold ore through the Magino mill were completed in the third quarter of 2024 and April 2025. In both instances, Island Gold ore was blended with Magino ore and processed through the Magino mill with recoveries in line with expectations. With the successful batch tests, and the Magino mill continuing to ramp up towards 11,200 tpd, the Company expects to transition to processing Island Gold ore through the Magino mill in the third quarter of 2025.
The mill feed is based on a 9:1 blend ratio of Magino and Island Gold ore at a combined throughput of 11,200 tpd. Island Gold ore feed will start at 1,200 tpd, increasing to 1,400 tpd by the end of 2025. Magino ore feed will fluctuate between 9,200 tpd and 10,000 tpd. The overall gold recovery from the blend is expected to be approximately 96%.
Expansion to 12,400 tpd
To accommodate the increased underground mining rates from Island Gold of 2,400 tpd following completion of the Phase 3+ Expansion in 2026, a number of improvements will be implemented to support increased milling rates within the Magino mill of 12,400 tpd. Many of the changes are being designed and sized to accommodate a potential further expansion of the mill to between 18,000 and 20,000 tpd. The key additions include:
- New underground crusher at Island Gold. Ore will be crushed underground and then trucked to the Magino mill minimizing crushing requirements within the mill
- Pebble crusher and auxiliary mill are expected to be added to the Magino grinding circuit to grind material from the SAG mill and ball mill, respectively
- New gold recovery plant will be added to support increased gold production and will include pre-oxidation, leaching carbon-in-leach, elution, electrowinning and smelting
- The new mill building is being designed to allow space for the addition of a second SAG and ball mill to the overall circuit to support a potential further expansion of the mill up to 20,000 tpd
- CIP tanks within the plant are being sized to accommodate up to a 20,000 tpd processing rate
- The foundation is being sized to hold four additional leach tanks in support of expanding to 12,400 tpd as well as more tanks for a potential larger expansion of up to 20,000 tpd
- The new gold room is being designed to support a potential expansion up to 20,000 tpd
Ore from Island Gold underground will be hauled to the Magino mill on the recently completed 6.5 kilometre road connecting the shaft area to the Magino mill. The ore feed blend will include 2,400 tpd of underground ore and 10,000 tpd of open pit ore with overall recoveries from the expanded circuit expected to average 96.3%.
The expansion of the Magino mill is expected to be completed in the third quarter of 2026 to coincide with the completion of the Phase 3+ Expansion at Island Gold.
Tailings
The existing TMF at Magino will be utilized, with the Base Case LOM Plan requiring 81 mt of capacity. Under the Base Case plan, the TMF will be expanded in multiple stages using lifts. With a permitted capacity of 150 Mt under the Federal EIS, the Magino TMF is expected to have more than sufficient capacity to accommodate the Base Case LOM plan, as well as the Mineral Resource conversion that is expected to be incorporated a larger expansion of up to 20,000 tpd.
Operating Costs
Total cash costs are expected to average $699 per ounce and mine-site AISC $1,003 per ounce over the mine life. Post completion of the Phase 3+ Expansion (2026+) and over the initial 12 years that Island Gold underground is operating at 2,400 tpd, total cash costs are expected to average $581 per ounce and mine-site AISC averaging $915 per ounce. This represents a 23% and 19% decrease, respectively, from the mid-point of 2025 guidance reflecting the significant productivity improvements, increased automation, and higher throughput rates with a shaft-hoisting operation, as well as lower processing costs for Island Gold underground ore. Additionally, the Magino mill will benefit from lower-cost grid power following the completion of the 115kV power line project in 2026.
Over the life of mine, open pit mining costs are expected to average C$4.24 per tonne of material mined, and underground mining costs C$124 per tonne mined. The shaft will allow for unit underground mining costs to remain relatively stable as mining moves deeper compared to truck haulage where costs would continue to increase with depth. This will help ensure Island Gold remains one of the lowest cost mines in the world over the long-term.
Milling costs are expected to average C$16.74 per tonne, with Island Gold underground ore to be processed at lower costs using the Magino mill. Connecting the Magino mill to grid power in 2026 is expected to reduce long-term processing costs by approximately C$5 per tonne. This reduction in costs has been included in the current Base Case LOM Plan.
The breakdown of unit costs is summarized as follows.
| (in C$/tonne) | Base Case LOM1 as of Jan 1 2025 |
| Open Pit Mining (ore + waste) | $4.24 |
| Underground Mining (ore) | $124 |
| Milling (ore) | $16.74 |
| Admin (ore) | $13.73 |
| Total Cash Cost (US$/oz)2 - Average LOM | $699 |
| - 12-year average, 2026+ | $581 |
| Mine-site All-in Sustaining Costs (US$/oz)2 - Average LOM | $1,003 |
| - 12-year average, 2026+ | $915 |
- The Base Case LOM Plan includes a gold price of $3,000/oz in 2025 through to 2027, and a long-term (2028+) gold price of $2,400/oz, as well as a USD/CAD foreign exchange rate of $0.73:1 in 2025, $0.74:1 in 2026 and 2027, and $0.75:1 from 2028 onwards
- Please refer to Cautionary Notes on non-GAAP Measures and Additional GAAP Measures
Royalty
Production from both Island Gold and Magino are subject to third party net smelter return (“NSR”) royalties. At Island Gold, the total effective NSR royalty averages approximately 2.5% over the life of mine, based on ounces produced, with approximately 90% of this royalty paid in-kind (as ounces).
Magino is subject to a total effective NSR royalty averaging approximately 3.8% over the mine life based on ounces produced, with 3.0% paid in-kind (as ounces).
The accounting treatment requires that in-kind royalties be recorded at production cost which lowers royalty expense, with an offsetting reduction in revenue given in-kind ounces transferred to royalty holders do not meet the definition of sales. As a result, the average NSR included in the LOM for Island Gold is approximately 0.8% of revenue over the life of mine, and 2.2% of revenue for Magino over the life of mine.
There is no net impact on gross margin from the accounting for in-kind NSR royalties compared to cash-paid NSR royalties given the lower royalty expense is offset by a reduction in ounces sold.
Capital Costs
Total growth capital is estimated at $453 million (as of January 1, 2025), with the majority to be spent over the next two years. Growth capital is focused on completing the Phase 3+ Expansion and the Magino mill expansion to 12,400 tpd.
As of the end of 2024, $486 million had been spent on the Phase 3+ Expansion. Remaining growth capital on the Phase 3+ Expansion is expected to total $349 million bringing total expected capital for the expansion to $835 million. This represents a 5% increase from the updated total growth capital estimate of $796 million provided in September 2024. The increase reflects ongoing labour inflation, as well as the use of a contractor to support off shaft development, and construction activities related to the ore and waste handling system for a total increase of approximately $39 million.
The addition of a pebble crusher and auxiliary mill to the Magino mill to support 12,400 tpd represents a potential scope change at an additional cost of approximately $40 million. These component changes will be re-evaluated over the next several months to assess if they will be required as part of a potential larger expansion of up to 20,000 tpd. This evaluation process will be completed before finalizing a decision and committing capital.
The other key difference between Island Gold District remaining growth capital and the Phase 3+ Expansion is the addition of a truck shop at Magino at a cost of $28 million. This will support improved maintenance practices of the open pit mobile fleet and increased utilization rates. The construction of a truck shop had been deferred by the previous owner.
| Island Gold District: Growth Capital (in US$ millions) | Base Case LOM1 as of Jan 1 2025 |
| Remaining Phase 3+ Expansion Capital | $349 |
| Magino Mill - Pebble Crusher & Auxiliary mill | $40 |
| Magino Open Pit Truck Shop | $28 |
| Other | $36 |
| Total Growth Capital ($ million) | $453 |
| Total Growth Capital per ounce sold (US$/oz)2 | $76 |
- The Base Case LOM Plan includes a gold price of $3,000/oz in 2025 through to 2027, and a long-term (2028+) gold price of $2,400/oz, as well as a USD/CAD foreign exchange rate of $0.73:1 in 2025, $0.74:1 in 2026 and 2027, and $0.75:1 from 2028 onwards
- Please refer to the Cautionary Notes on non-GAAP Measures and Additional GAAP Measures
Sustaining capital is expected to total $1,808 million over the life of mine, including reclamation costs and capital leases. The key increases relative to the Phase 3+ Study reflect the addition of the Magino operation, as well as increased underground development at Island Gold. As noted above, increased development will support a better managed stress environment as the ore body continues to grow and mining extends deeper, while also allowing for higher mining rates beyond 2,400 tpd, which is being reviewed as part of the Expansion Study.
Sustaining capital per ounce is expected to decrease within the Expansion Study reflecting the potential inclusion of a larger Mineral Reserve, through ongoing Resource conversion, which will leverage infrastructure being constructed to support the Base Case operation.
| Island Gold District: Sustaining Capital (in US$ millions) | Base Case LOM1 as of Jan 1 2025 |
| Underground Capital Development | $691 |
| Open Pit Mobile Equipment and Maintenance | $295 |
| Open Pit Capitalized Stripping | $241 |
| Underground Mobile Equipment and Maintenance | $159 |
| Underground Infrastructure | $152 |
| Tailings Facility | $114 |
| Mill Maintenance | $37 |
| Other | $28 |
| Total Sustaining Capital | $1,715 |
| Reclamation | $46 |
| Total (including Reclamation) | $1,761 |
| Capital Leases | $46 |
| Total (including Reclamation and Capital Leases) | $1,808 |
| Total Sustaining Capital per ounce sold (US$/oz)2 | $304 |
- The Base Case LOM Plan includes a gold price of $3,000/oz in 2025 through to 2027, and a long-term (2028+) gold price of $2,400/oz, as well as a USD/CAD foreign exchange rate of $0.73:1 in 2025, $0.74:1 in 2026 and 2027, and $0.75:1 from 2028 onwards
- Please refer to the Cautionary Notes on non-GAAP Measures and Additional GAAP Measures
Combined growth and sustaining capital are expected to total $2.26 billion over the life of mine, or $380 per ounce sold.
Including operating costs and total capital, the all-in cost is expected to total $1,079 per ounce sold over the life of mine.
A breakdown of the capital requirements for the Base Case Life of Mine Plan is detailed as follows.
| Island Gold District: Total Capital (in US$ millions) | Base Case LOM1 as of Jan 1 2025 |
| Growth capital | $453 |
| Sustaining capital | $1,808 |
| Total Capital | $2,261 |
| Total Capital per ounce sold (US$/oz)2 | $380 |
- The Base Case LOM Plan includes a gold price of $3,000/oz in 2025 through to 2027, and a long-term (2028+) gold price of $2,400/oz, as well as a USD/CAD foreign exchange rate of $0.73:1 in 2025, $0.74:1 in 2026 and 2027, and $0.75:1 from 2028 onwards
- Please refer to the Cautionary Notes on non-GAAP Measures and Additional GAAP Measures
Taxes
At current gold prices of approximately $3,300 per ounce and taking into account existing income tax pools of approximately C$2 billion, the Island Gold District is not expected to pay any significant taxes until 2026. At a long-term gold price of $2,400 and USD/CAD foreign exchange rate of $0.75:1, the Island Gold District is expected to pay approximately $2.2 billion in federal and provincial income taxes and Ontario mining taxes over the life of the mine. The effective tax rate is expected to average approximately 25% reflecting the use of the substantial tax pools.
Permitting
The Island Gold District has all the key permits in place for the current operation, with normal course permits required for further expansions of the operation. The Closure Plan Amendment (“CPA”) for the Island Gold mine was received in March 2022 allowing for the ramp up of construction activities for the original Phase III expansion to 2,000 tpd. In December 2023, another CPA was approved that incorporated scope changes in the Phase 3+ Expansion to operate at 2,400 tpd.
The CPA for the Magino mine was approved in September 2024. Under the approved Federal Environmental Impact Statement (“EIS”), the Magino mill is permitted to operate at a processing rate of 35,000 tpd, well above the current rates. The TMF at Magino is permitted under the Federal EIS to contain up to 150 mt of material. This is more than sufficient tailings capacity for the Base Case LOM Plan as well as the expected larger Mineral Reserve to be incorporated in the Expansion Study.
For the expansion to 12,400 tpd, there are a number of normal course provincial permits that will be required including an amendment to the Environmental Compliance Approval (“ECA”). The ECA will also need to be amended for any potential further expansion up to 20,000 tpd as will the CPA. These are permit amendments that have been approved multiple times previously. All permitting activities fall within a well known jurisdiction where Alamos has successfully operated for years, achieving various permitting milestones at both of its Young-Davidson and Island Gold mines.
Upside to Base Case LOM Plan:
Expansion Study expected to be released in the fourth quarter of 2025
The Base Case LOM Plan is based only on Mineral Reserves and long-term milling rates of 12,400 tpd. The Expansion Study to be released in the fourth quarter of 2025 is expected to demonstrate attractive economics and significant upside to the Base Case with the key drivers as follows:
- Potential mill expansion to between 18,000 and 20,000 tpd
- Increased mining rates and processing rates at both Island Gold underground and Magino open pit
- Conversion and incorporation of a significant portion of the large Mineral Resource base through ongoing delineation drilling. Current Mineral Resources consist of:
- Island Gold Underground
- M&I Mineral Resources: 1.0M oz grading 10.49 g/t Au (3.1Mt)
- Inferred Mineral Resources: 1.3M oz grading 16.88 g/t Au (2.4Mt)
- Magino Open Pit
- M&I Mineral Resources: 1.8M oz grading 0.91 g/t Au (60.3Mt)
- Inferred Mineral Resources: 1.2M oz grading 0.92 g/t Au (40.3Mt)
- Island Gold Underground
Key elements of a larger expansion have been de-risked, including:
- Magino mill federally permitted to operate at 35,000 tpd
- Magino tailings management facility (“TMF”) permitted to accommodate a total of 150 mt
- Components of the Base Case expansion to 12,400 tpd are being designed or sized to accommodate a potential further expansion up to 20,000 tpd
- Island Gold shaft is designed to a hoisting capacity of 5,500 tpd at the current planned depth, well above current requirements in the Base Case LOM Plan
- Underground ore and waste handling system at Island Gold can support well in excess of 2,400 tpd
- The 115kV powerline project will provide additional capacity sufficient to supply all power needs from the electric grid for an expanded operation
- Large and growing Mineral Reserve and Resource base can support a larger expansion
Significant exploration upside
The Island Gold District remains highly prospective, with significant exploration upside that can support further potential growth over the longer term, including:
- Island Gold underground: high-grade mineralization remains open laterally and at depth, with increasing grades and ounces per vertical metre at depth
- Magino open pit: potential for expansion of near surface mineralization to the southwest of the Mineral Resource pit with additional drilling. There is also potential to expand gold mineralization below the southwestern extent of the Mineral Resource pit, where drilling to date has been shallower relative to the northeast
- Regional targets: the Island Gold District is comprised of a large, underexplored 60,000 hectare land package in the Michipicoten Greenstone Belt. This includes the high-grade past producing Cline, Edwards, and Kremzar mines, as well as a number of highly prospective targets in proximity to the Magino mill (including the North Shear, Pick, and 88-60 targets). These targets, and a pipeline of other targets at various stages, represent potential opportunities for additional higher-grade mill feed within a larger mill expansion to supplement ore from Island Gold and Magino
Technical Disclosure
Chris Bostwick, FAusIMM, Alamos Gold’s Senior Vice President, Technical Services, has reviewed and approved the scientific and technical information contained in this news release. Mr. Bostwick is a Qualified Person within the meaning of Canadian Securities Administrator's National Instrument 43-101 ("NI 43-101").
The Company will file a technical report prepared in accordance with NI 43-101 on SEDAR+ at www.sedarplus.ca within 45 days of the date of this release.
About Alamos
Alamos is a Canadian-based intermediate gold producer with diversified production from three operations in North America. This includes the Island Gold District and Young-Davidson mine in northern Ontario, Canada, and the Mulatos District in Sonora State, Mexico. Additionally, the Company has a strong portfolio of growth projects, including the Phase 3+ Expansion at Island Gold, and the Lynn Lake project in Manitoba, Canada. Alamos employs more than 2,400 people and is committed to the highest standards of sustainable development. The Company’s shares are traded on the TSX and NYSE under the symbol “AGI”.
FOR FURTHER INFORMATION, PLEASE CONTACT:
| Scott K. Parsons |
| Senior Vice President, Corporate Development & Investor Relations |
| (416) 368-9932 x 5439 |
| Khalid Elhaj |
| Vice President, Business Development & Investor Relations |
| (416) 368-9932 x 5427 |
| ir@alamosgold.com |
The TSX and NYSE have not reviewed and do not accept responsibility for the adequacy or accuracy of this release.
Cautionary Note
This news release contains or incorporates by reference “forward-looking statements” and “forward-looking information” as defined under applicable Canadian and U.S. securities laws. All statements in this news release, other than statements of historical fact, which address events, results, outcomes or developments that the Company expects to occur are, or may be deemed to be, forward-looking statements and are generally, but not always, identified by the use of forward-looking terminology such as "expect", “assumption”, “anticipate”, “intend”, “potential”, “opportunity” “plan”, “estimate”, “continue”, “ongoing”, “evaluating”, “on track”, “target” or variations of such words and phrases and similar expressions or statements that certain actions, events or results “may", “could”, “would”, "might" or "will" be taken, occur or be achieved or the negative connotation of such terms. Forward-looking statements contained in this news release are based on information, expectations, estimates and projections as of the date of this news release.
Forward-looking statements in this news release include, but may not be limited to, information, assumptions, expectations and guidance as to strategy, plans, and future financial and operating performance, such as those regarding: the Base Case Life of Mine Plan for the Island Gold District; mine life; Mineral Reserves and Mineral Reserve life; Measured and Indicated and Inferred Resources and expected conversion of the Mineral Resource base at the Island Gold District deposits and the timing of that expected conversion; size, length, and anticipated cost profile and profitability of operations at the Island Gold District; expected timing of the release of an Expansion Study and detail to be incorporated therein; further expansions of the operations at the Island Gold District; costs (including cash costs, AISC, mine-site AISC, growth capital, sustaining capital, total capital expenditures); cost structure and anticipated declining cost profile; budgets; free cash flow; NPV calculations; payment of taxes; gold and other metal price assumptions; foreign exchange rates; mining, milling and processing rates; total mill feed and throughput rates; expected average recoveries; anticipated gold production, production rates, timing of production, further production potential and growth; mined and processed gold grades and weights; the Phase 3+ Expansion at Island Gold and timing of its progress and completion; project-related risks; new mining approaches to the Island Gold underground mine, expected increased in underground development and resulting improvements in mining stress management and mining rates; intended method of mining the Magino open pit; intended use of the Magino mill and tailings facility; operational savings to be achieved through the use of the Magino mill; future expansion of the Magino mill; planned exploration, exploration potential and results; anticipated results of the delineation drilling program; anticipated timing of the completion of the 115kV powerline project; the expectation that the Magino mill will be connected to grid power in 2026; reduction in greenhouse gas emissions and intensity; permitting requirements for expanded operations and expectations that permits will be received; returns to stakeholders; and any other statements or information that express management's expectations or estimates of future performance, operational, geological or financial results.
Exploration results that include geophysics, sampling, and drill results on wide spacings may not be indicative of the occurrence of a mineral deposit. Such results do not provide assurance that further work will establish sufficient grade, continuity, metallurgical characteristics and economic potential to be classed as a category of Mineral Resource. A Mineral Resource that is classified as "Inferred" or "Indicated" has a great amount of uncertainty as to its existence and economic and legal feasibility. It cannot be assumed that any or part of an "Indicated Mineral Resource" or "Inferred Mineral Resource" will ever be upgraded to a higher category of Mineral Resource. Investors are cautioned not to assume that all or any part of mineral deposits in these categories will ever be converted into Proven and Probable Mineral Reserves.
The Company cautions that forward-looking statements are necessarily based upon several factors and assumptions that, while considered reasonable by management at the time of making such statements, are inherently subject to significant business, economic, technical, legal, political, and competitive uncertainties, and contingencies. Known and unknown factors could cause actual results to differ materially from those projected in the forward-looking statements, and undue reliance should not be placed on such statements and information.
Such factors include (without limitation): the actual results of current and future exploration activities; changes to current estimates of mineral reserves and mineral resources; conclusions of economic and geological evaluations; changes in project parameters as plans continue to be refined; the speculative nature of mineral exploration and development; risks in obtaining and maintaining necessary licenses, permits and authorizations for the Company’s development stage and operating assets; operations may be exposed to new illnesses, diseases, epidemics and/or pandemics which may have impacts on the broader market and the trading price of the Company’s shares and may affect many aspects of the Company's operations including the ability to transport personnel to and from site, contractor and supply availability and the ability to sell or deliver gold doré bars; changes in national and local government legislation, controls or regulations; failure to comply with environmental and health and safety laws and regulations; labour and contractor availability (and being able to secure the same on favourable terms); disruptions in the maintenance or provision of required infrastructure and information technology systems; fluctuations in the price of gold or certain other commodities such as, diesel fuel, natural gas, and electricity; operating or technical difficulties in connection with mining or development activities, including geotechnical challenges and changes to production estimates (which assume accuracy of projected ore grade, mining rates, recovery timing and recovery rate estimates and may be impacted by unscheduled maintenance, weather issues, labour and contractor availability and other operating or technical difficulties); changes in foreign exchange rates (particularly the Canadian dollar, U.S. dollar, Mexican peso and Turkish Lira); the impact of inflation; any tariffs, trade barriers, and/or regulatory costs; employee and community relations; the impact of litigation and administrative proceedings; disruptions affecting operations; risks associated with the start-up of new mines; availability of and increased costs associated with mining inputs and labour; delays in the Phase 3+ Expansion at Island Gold; delays in construction of the 115kVpowerline; changes with respect to the intended method of mining and processing ore from the Island Gold District; inherent risks and hazards associated with mining and mineral processing including environmental hazards, industrial accidents, unusual or unexpected formations, pressures and cave-ins; the risk that the Company’s mines may not perform as planned; uncertainty with the Company's ability to secure additional capital to execute its business plans; contests over title to properties; expropriation or nationalization of property; political or economic developments in Canada, Mexico, the United States, Türkiye and other jurisdictions in which the Company may carry on business in the future; increased costs and risks related to the potential impact of climate change; the costs and timing of exploration, construction and development of new deposits; risk of loss due to sabotage, protests and other civil disturbances; the impact of global liquidity and credit availability and the values of assets and liabilities based on projected future cash flows; risks arising from holding derivative instruments; and business opportunities that may be pursued by the Company.
For a more detailed discussion of such risks and other risk factors that may affect the Company's ability to achieve the expectations set forth in the forward-looking statements contained in this news release, see the Company’s latest 40-F/Annual Information Form and Management’s Discussion and Analysis, each under the heading “Risk Factors” available on the SEDAR+ website at www.sedarplus.ca or on EDGAR at www.sec.gov. The foregoing should be reviewed in conjunction with the information, risk factors and assumptions found in this news release.
The Company disclaims any intention or obligation to update or revise any forward-looking statements whether as a result of new information, future events or otherwise, except as required by applicable law.
Cautionary Note to U.S. Investors
Alamos prepares its disclosure in accordance with the requirements of securities laws in effect in Canada. Unless otherwise indicated, all Mineral Resource and Mineral Reserve estimates included in this document have been prepared in accordance with Canadian National Instrument 43-101 - Standards of Disclosure for Mineral Projects (“NI 43-101”) and the Canadian Institute of Mining, Metallurgy and Petroleum (the “CIM”) - CIM Definition Standards on Mineral Resources and Mineral Reserves, adopted by the CIM Council, as amended (the “CIM Standards”). NI 43-101 is a rule developed by the Canadian Securities Administrators, which established standards for all public disclosure an issuer makes of scientific and technical information concerning mineral projects. Mining disclosure in the United States was previously required to comply with SEC Industry Guide 7 (“SEC Industry Guide 7”) under the United States Securities Exchange Act of 1934, as amended. The U.S. Securities and Exchange Commission (the “SEC”) has adopted final rules, to replace SEC Industry Guide 7 with new mining disclosure rules under sub-part 1300 of Regulation S-K of the U.S. Securities Act (“Regulation S-K 1300”) which became mandatory for U.S. reporting companies beginning with the first fiscal year commencing on or after January 1, 2021. Under Regulation S-K 1300, the SEC now recognizes estimates of “Measured Mineral Resources”, “Indicated Mineral Resources” and “Inferred Mineral Resources”. In addition, the SEC has amended its definitions of “Proven Mineral Reserves” and “Probable Mineral Reserves” to be substantially similar to international standards.
Investors are cautioned that while the above terms are “substantially similar” to CIM Definitions, there are differences in the definitions under Regulation S-K 1300 and the CIM Standards. Accordingly, there is no assurance any mineral reserves or mineral resources that the Company may report as “proven mineral reserves”, “probable mineral reserves”, “measured mineral resources”, “indicated mineral resources” and “inferred mineral resources” under NI 43-101 would be the same had the Company prepared the mineral reserve or mineral resource estimates under the standards adopted under Regulation S-K 1300. U.S. investors are also cautioned that while the SEC recognizes “measured mineral resources”, “indicated mineral resources” and “inferred mineral resources” under Regulation S-K 1300, investors should not assume that any part or all of the mineralization in these categories will ever be converted into a higher category of mineral resources or into mineral reserves. Mineralization described using these terms has a greater degree of uncertainty as to its existence and feasibility than mineralization that has been characterized as reserves. Accordingly, investors are cautioned not to assume that any measured mineral resources, indicated mineral resources, or inferred mineral resources that the Company reports are or will be economically or legally mineable.
Cautionary Notes on non-GAAP Measures and Additional GAAP Measures
Note that for purposes of this section, GAAP refers to IFRS. The Company believes that investors use certain non-GAAP and additional GAAP measures as indicators to assess gold mining companies. They are intended to provide additional information and should not be considered in isolation or as a substitute for measures of performance prepared with GAAP.
“Cash flow from operating activities before changes in non-cash working capital” is a non-GAAP performance measure that could provide an indication of the Company’s ability to generate cash flows from operations and is calculated by adding back the change in non-cash working capital to “cash provided by (used in) operating activities” as presented on the Company’s consolidated statements of cash flows. “Cash flow per share” is calculated by dividing “cash flow from operations before changes in working capital” by the weighted average number of shares outstanding for the period. “Free cash flow” is a non-GAAP performance measure that is calculated as cash flows from operations net of cash flows invested in mineral property, plant and equipment and exploration and evaluation assets as presented on the Company’s consolidated statements of cash flows and that would provide an indication of the Company’s ability to generate cash flows from its mineral projects. “Mine site free cash flow” is a non-GAAP measure which includes cash flow from operating activities at, less capital expenditures at each mine site. “Return on equity” is defined as earnings from continuing operations divided by the average total equity for the current and previous year. “Mining cost per tonne of ore” and “cost per tonne of ore” are non-GAAP performance measures that could provide an indication of the mining and processing efficiency and effectiveness of the mine. These measures are calculated by dividing the relevant mining and processing costs and total costs by the tonnes of ore processed in the period. “Cost per tonne of ore” is usually affected by operating efficiencies and waste-to-ore ratios in the period. “Total capital expenditures per ounce produced” is a non-GAAP term used to assess the level of capital intensity of a project and is calculated by taking the total growth and sustaining capital of a project divided by ounces produced life of mine. “Growth capital” are expenditures primarily incurred at development projects and costs related to major projects at existing operations, where the projects will materially benefit the mine site. “Sustaining capital” are expenditures that do not increase annual gold ounce production at a mine site and excludes all expenditures at the Company’s development projects. “Total cash costs per ounce”, “all-in sustaining costs per ounce”, “mine-site all-in sustaining costs”, and “all-in costs per ounce” as used in this analysis are non-GAAP terms typically used by gold mining companies to assess the level of gross margin available to the Company by subtracting these costs from the unit price realized during the period. These non-GAAP terms are also used to assess the ability of a mining company to generate cash flow from operations. There may be some variation in the method of computation of these metrics as determined by the Company compared with other mining companies. In this context, “total cash costs” reflects mining and processing costs allocated from in-process and doré inventory and associated royalties with ounces of gold sold in the period. Total cash costs per ounce are exclusive of exploration costs. “All-in sustaining costs per ounce” include total cash costs, exploration, corporate and administrative, share based compensation and sustaining capital costs. “Mine-site all-in sustaining costs” include total cash costs, exploration, and sustaining capital costs for the mine-site, but exclude an allocation of corporate and administrative and share based compensation. “Capitalized exploration” are expenditures that meet the IFRS definition for capitalization and are incurred to further expand the known Mineral Reserve and Resource at existing operations or development projects. “Adjusted net earnings” and “adjusted earnings per share” are non-GAAP financial measures with no standard meaning under IFRS. “Adjusted net earnings” and “adjusted earnings per share” are non-GAAP financial measures with no standard meaning under IFRS. “Adjusted net earnings” excludes the following from net earnings: foreign exchange gain (loss), items included in other loss, certain non-reoccurring items, and foreign exchange gain (loss) recorded in deferred tax expense. “Adjusted earnings per share” is calculated by dividing “adjusted net earnings” by the weighted average number of shares outstanding for the period.
Additional GAAP measures that are presented on the face of the Company’s consolidated statements of comprehensive income and are not meant to be a substitute for other subtotals or totals presented in accordance with IFRS, but rather should be evaluated in conjunction with such IFRS measures. This includes “Earnings from operations”, which is intended to provide an indication of the Company’s operating performance and represents the amount of earnings before net finance income/expense, foreign exchange gain/loss, other income/loss, and income tax expense. Non-GAAP and additional GAAP measures do not have a standardized meaning prescribed under IFRS and therefore may not be comparable to similar measures presented by other companies. A reconciliation of historical non-GAAP and additional GAAP measures are detailed in the Company’s latest Management’s Discussion and Analysis available online on the SEDAR+ website at www.sedarplus.ca or on EDGAR at www.sec.gov and at www.alamosgold.com.
Table 1: Base Case Life of Mine Plan – Detailed Summary
| LOM avg | 2025 | 2026 | 2027 | 2028 | 2029 | 2030 | 2031 | 2032 | 2033 | 2034 | 2035 | 2036 | 2037 | 2038 | 2039 | 2040 | 2041 | 2042 | 2043 | 2044 | |
| Underground ore mined (tpd) | 2,148 | 1,319 | 1,914 | 2,405 | 2,399 | 2,400 | 2,400 | 2,400 | 2,399 | 2,400 | 2,400 | 2,400 | 2,353 | 2,304 | 1,713 | 1,018 | - | - | - | - | - |
| Open pit ore mined (tpd) | 13,238 | 14,545 | 23,437 | 21,030 | 15,462 | 17,227 | 14,697 | 2,577 | 4,233 | 10,234 | 14,893 | 20,253 | 16,209 | 7,307 | 15,347 | 1,112 | - | - | - | - | - |
| Open pit total tonnes mined(tpd) | 62,152 | 56,891 | 64,635 | 72,337 | 73,566 | 73,767 | 73,767 | 66,344 | 67,826 | 63,932 | 63,932 | 63,932 | 63,757 | 61,238 | 63,932 | 2,428 | - | - | - | - | - |
| Underground ore processed (tpd) | 2,149 | 1,332 | 1,914 | 2,405 | 2,399 | 2,400 | 2,400 | 2,400 | 2,399 | 2,400 | 2,400 | 2,400 | 2,353 | 2,304 | 1,713 | 1,021 | - | - | - | - | - |
| Open pit ore processed (tpd) | 10,523 | 9,106 | 9,286 | 9,995 | 10,001 | 10,000 | 10,000 | 10,000 | 10,001 | 10,000 | 10,000 | 10,000 | 10,047 | 10,096 | 10,687 | 11,379 | 12,400 | 12,400 | 12,400 | 12,400 | 10,270 |
| Total ore processed (tpd) | 12,135 | 10,437 | 11,200 | 12,400 | 12,400 | 12,400 | 12,400 | 12,400 | 12,400 | 12,400 | 12,400 | 12,400 | 12,400 | 12,400 | 12,400 | 12,400 | 12,400 | 12,400 | 12,400 | 12,400 | 10,270 |
| Underground grade processed (g/t Au) | 10.85 | 11.69 | 10.85 | 10.69 | 12.41 | 12.88 | 12.54 | 10.97 | 12.24 | 12.69 | 11.09 | 9.76 | 8.14 | 8.25 | 7.41 | 9.66 | - | - | - | - | - |
| Open pit grade processed (g/t Au) | 0.91 | 0.95 | 1.08 | 0.96 | 1.14 | 1.00 | 1.24 | 0.70 | 0.72 | 1.01 | 1.25 | 1.23 | 1.20 | 0.83 | 0.91 | 0.70 | 0.69 | 0.69 | 0.69 | 0.69 | 0.69 |
| Processed grade - combined (g/t Au) | 2.23 | 2.32 | 2.75 | 2.85 | 3.32 | 3.30 | 3.43 | 2.69 | 2.95 | 3.27 | 3.16 | 2.88 | 2.51 | 2.21 | 1.81 | 1.44 | 0.69 | 0.69 | 0.69 | 0.69 | 0.69 |
| Gold production (oz) | 305,594 | 275,543 | 346,845 | 395,237 | 470,515 | 465,891 | 484,729 | 378,076 | 417,249 | 462,468 | 445,407 | 405,498 | 353,437 | 308,278 | 251,656 | 198,996 | 93,373 | 93,118 | 93,118 | 93,118 | 79,332 |
| Gold sales (oz)1 | 297,739 | 264,935 | 338,814 | 385,348 | 459,343 | 455,847 | 472,938 | 368,765 | 406,887 | 450,538 | 434,523 | 395,788 | 344,790 | 300,564 | 244,949 | 194,186 | 90,572 | 90,324 | 90,324 | 90,324 | 75,012 |
| Operating costs | |||||||||||||||||||||
| Underground mining costs (C$/tonne) | $124 | $166 | $133 | $116 | $117 | $116 | $117 | $119 | $122 | $122 | $122 | $124 | $128 | $134 | $137 | $85 | - | - | - | - | - |
| Open pit mining costs (C$/tonne) | $4.24 | $5.84 | $3.98 | $3.72 | $3.91 | $3.86 | $3.91 | $4.13 | $3.93 | $4.16 | $4.31 | $4.40 | $4.38 | $3.93 | $4.02 | $38.99 | - | - | - | - | - |
| Unit milling costs (C$/tonne) | $16.74 | $24.66 | $20.70 | $16.96 | $16.96 | $16.96 | $16.96 | $16.96 | $16.96 | $16.96 | $16.96 | $16.96 | $16.91 | $16.86 | $16.25 | $15.55 | $14.50 | $14.50 | $14.50 | $14.50 | $14.50 |
| Unit G&A costs (C$/tonne) | $13.73 | $20.25 | $14.47 | $13.84 | $13.79 | $13.61 | $13.89 | $13.20 | $13.70 | $14.15 | $14.11 | $15.41 | $16.07 | $17.64 | $17.66 | $14.14 | $11.96 | $10.95 | $9.31 | $7.61 | $9.09 |
| Total cash costs(US$/oz)2 | $699 | $886 | $626 | $523 | $469 | $516 | $451 | $624 | $586 | $582 | $568 | $587 | $698 | $888 | $966 | $999 | $1,696 | $1,649 | $1,584 | $1,520 | $1,590 |
| Mine-site AISC (US$/oz)2,3 | $1,003 | $1,247 | $1,006 | $933 | $842 | $814 | $773 | $1,116 | $990 | $850 | $871 | $875 | $941 | $1,117 | $1,098 | $1,114 | $1,742 | $1,724 | $1,649 | $1,551 | $1,950 |
| Capital expenditures | LOMtotal | ||||||||||||||||||||
| Sustaining capex (US$M) | $1,761 | $79 | $117 | $150 | $169 | $135 | $152 | $181 | $163 | $120 | $130 | $113 | $83 | $68 | $32 | $22 | $4 | $7 | $6 | $3 | $27 |
| Sustaining capital leases (US$M) | $46 | $17 | $12 | $8 | $2 | $1 | $1 | $1 | $1 | $1 | $2 | $1 | $1 | $0 | $0 | $0 | $0 | - | - | - | - |
| Growth capex (US$M) | $453 | $302 | $139 | $12 | - | - | - | - | - | - | - | - | - | - | - | - | - | - | - | - | - |
| Total capex (US$M) | $2,261 | $398 | $268 | $170 | $171 | $136 | $152 | $181 | $164 | $121 | $132 | $114 | $84 | $69 | $32 | $22 | $4 | $7 | $6 | $3 | $27 |
1 Gold sales are lower than gold production reflecting the delivery of in-kind royalties on Island Gold and Magino
2 Please refer to Cautionary Notes on non-GAAP Measures and Additional GAAP Measures
3 For the purposes of calculating mine-site all-in sustaining costs, the Company does not include an allocation of corporate and administrative expense and corporate share-based compensation expense
Figure 1: Island Gold District Map
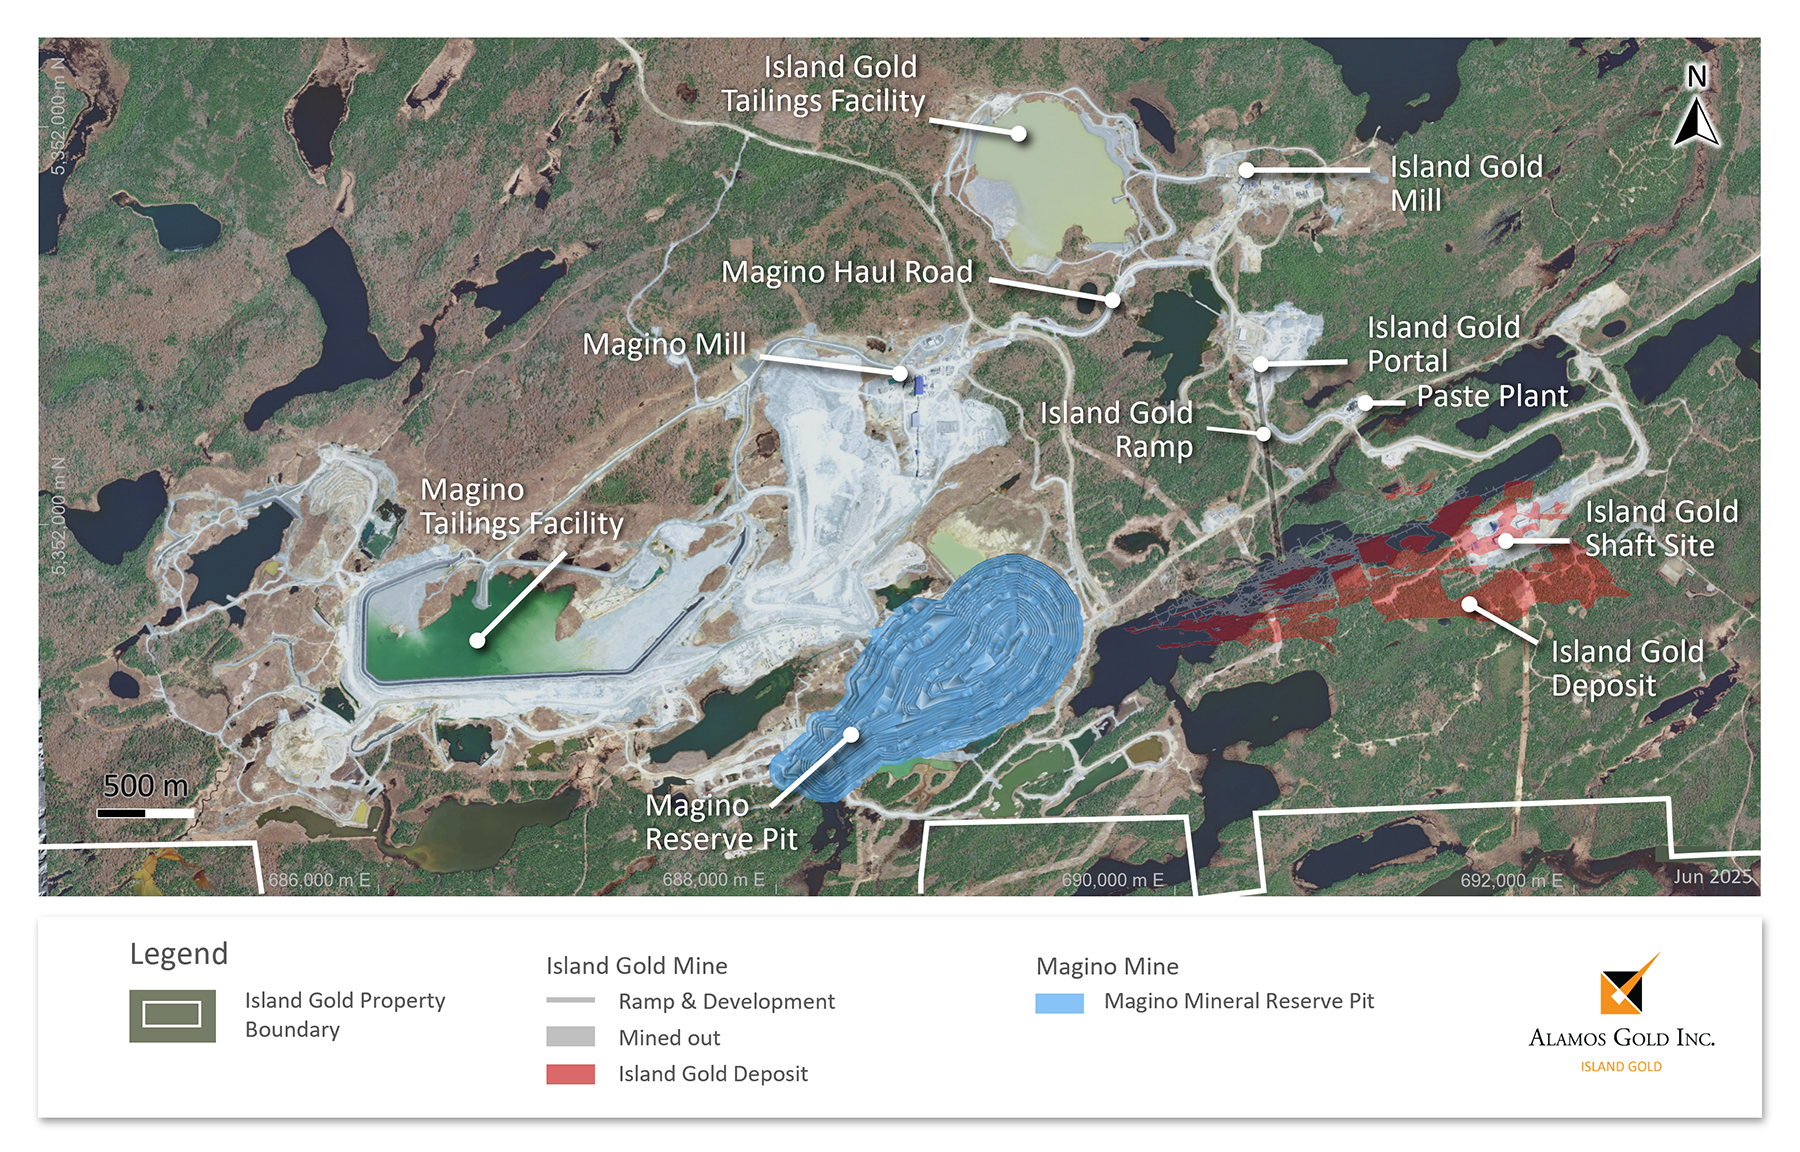
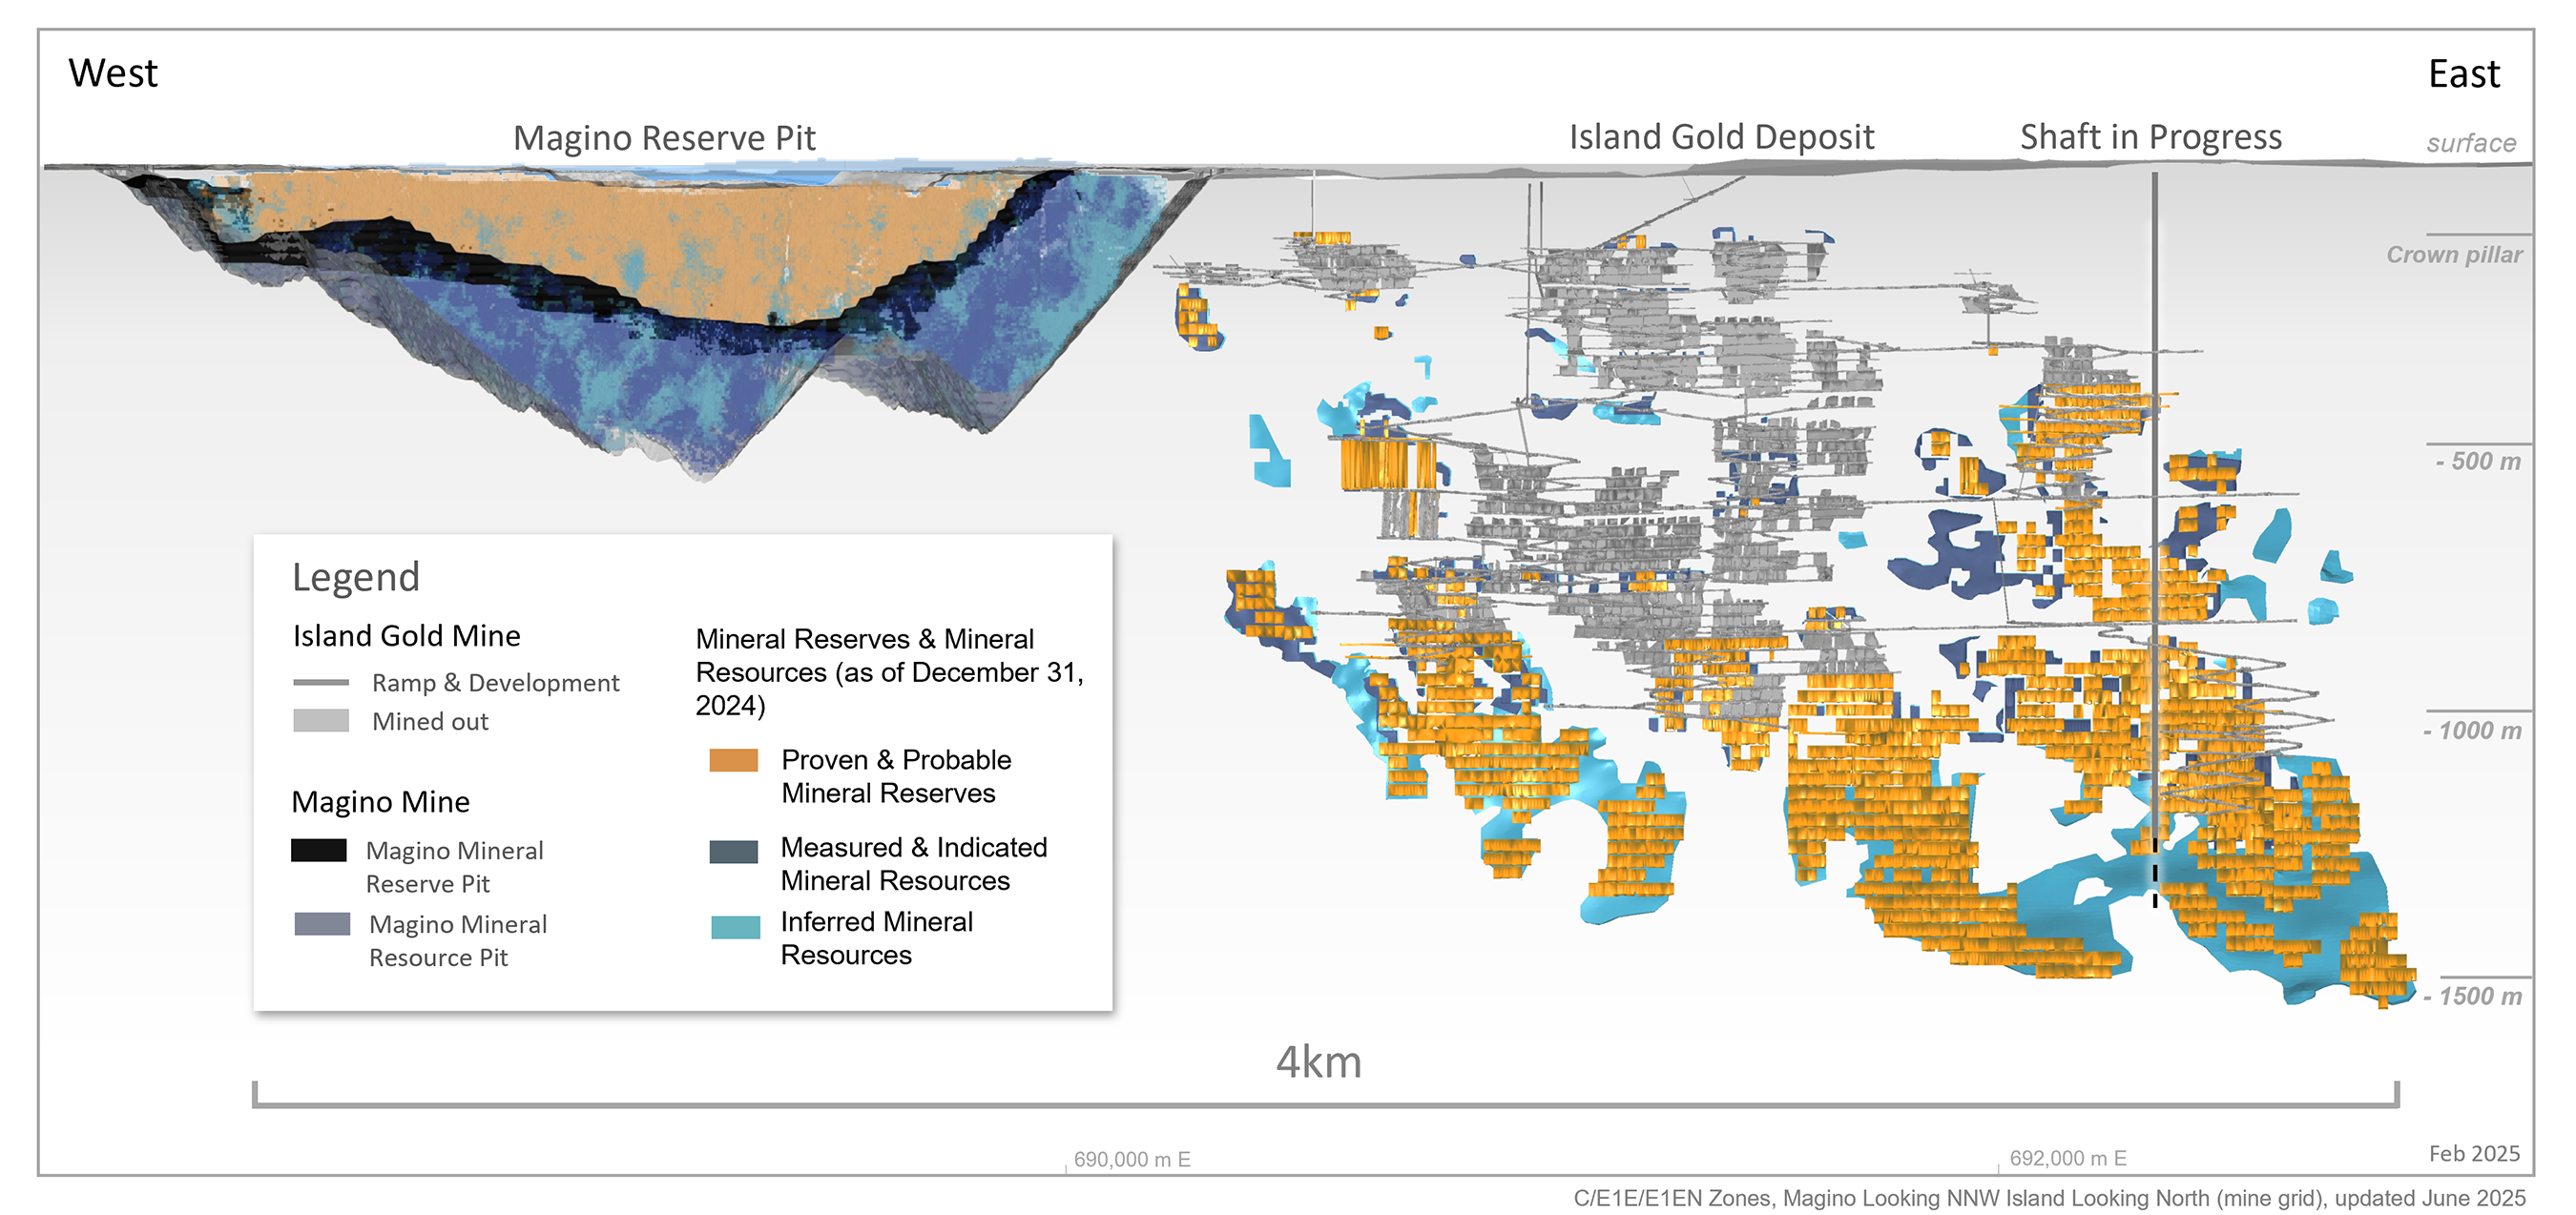
Figure 2: Island Gold District – Long Section
Photos accompanying this announcement are available at
https://www.globenewswire.com/NewsRoom/AttachmentNg/40572662-45f1-4d8f-9573-7b23ed1e9a2d
https://www.globenewswire.com/NewsRoom/AttachmentNg/bdd43d6a-b11c-414d-b298-2da3be47292d
https://www.globenewswire.com/NewsRoom/AttachmentNg/35dd7aa7-7fbd-40b5-970d-4ad8ab98e0c1
https://www.globenewswire.com/NewsRoom/AttachmentNg/9b82cbd3-7359-45ee-86e0-58217a8be51b
https://www.globenewswire.com/NewsRoom/AttachmentNg/70249e39-cf1f-44b7-a7b9-73c6bd940e45

![]()


