Nvidia (NVDA), the leading artificial intelligence company, is now a $4.7 trillion stock. Perhaps you’ve heard of it.
With its quarterly earnings due next Wednesday, Nov. 19, rest assured Wall Street will be ready for its biggest event this side of Super Bowl Sunday.
NVDA stock has done so well for shareholders in the past several years, it is now exactly one-twelfth, or 8.33%, of the entire S&P 500 Index ($SPX), all by itself. As a long-time market tracker, I have to say, I can’t believe I could even type that factually.
But with success comes pressure to keep up. And the expectations for the company, that is the glue that holds the AI trade together, are as high as ever. Maybe higher. And that once again has me thinking about what I often do with stocks that have appreciated like this: I collar them.
To be very clear here, an option collar around a stock or exchange-traded fund (ETF) is not the same as being bearish on the stock. Or bullish. In fact, if I had to rate NVDA currently, given the charts I’ll show you below, I’d rate it neither buy nor sell. I’d rate it “collar.”
Specifically, I see big risk in the stock due to concerns about unmet expectations. We’ve seen it tank in past quarters for that same reason. And while more often than not, it blows away analyst estimates, there’s such a swirl of sentiment and emotion around NVDA that there’s a risk of an expiration of the sugar high any time it reports.
Why Should You Collar Nvidia?
So, why not continue to be exposed to upside potential, while setting a line in the sand on the downside? If that logic makes sense to you, and you own NVDA, that’s a reason to consider collaring it.
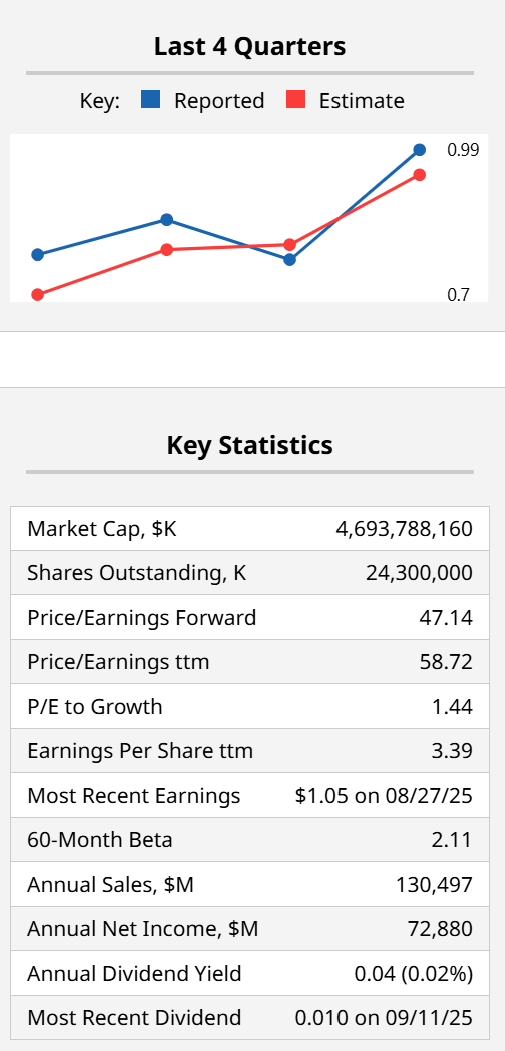
Here’s what the stock’s fundamentals look like. Not that Wall Street has shown any concern for the stock’s 58x trailing price-earnings ratio. That said, it is growing so fast, there’s a good case to make that it is keeping up with expectations. But Wall Street can be a fickle place. Thus, the collar.
Is NVDA’s Chart Bullish or Bearish?
As always, time frame matters. Though in this case, the daily and weekly views produce a similar conclusion.
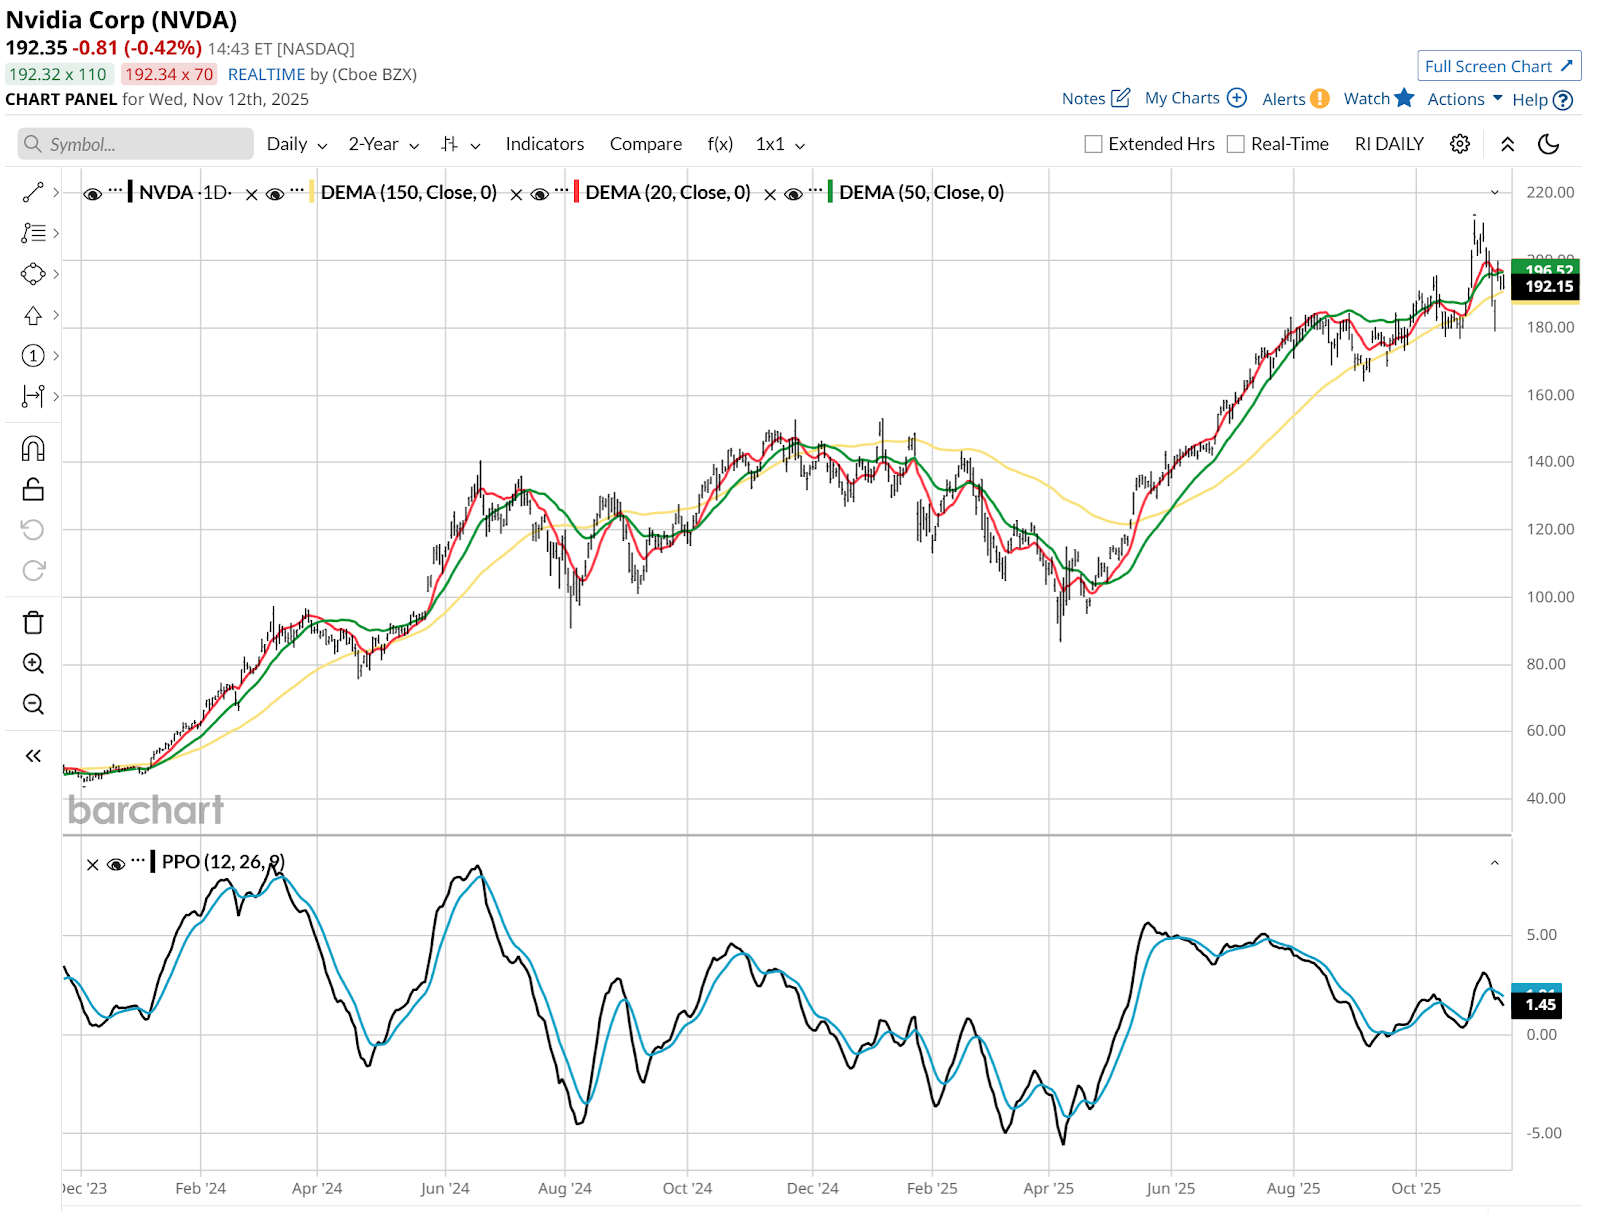
NVDA stock trades like the market is excited but waiting for confirmation of something. With earnings less than a week away, I think we know what that “something” is. The 20-day moving average took a quick step back recently. But NVDA, as much as any stock I follow, has a habit of breaking chart rules.
That 20-day rolling over action is usually a high-percentage shot that leads to the stock continuing in that direction. But NVDA has just dipped here. With dip-buying having become the new national pastime for many retail investors, the institutions are likely catching on to that. Summary: It takes a lot more than a little bend south in the chart to shake out NVDA bulls.
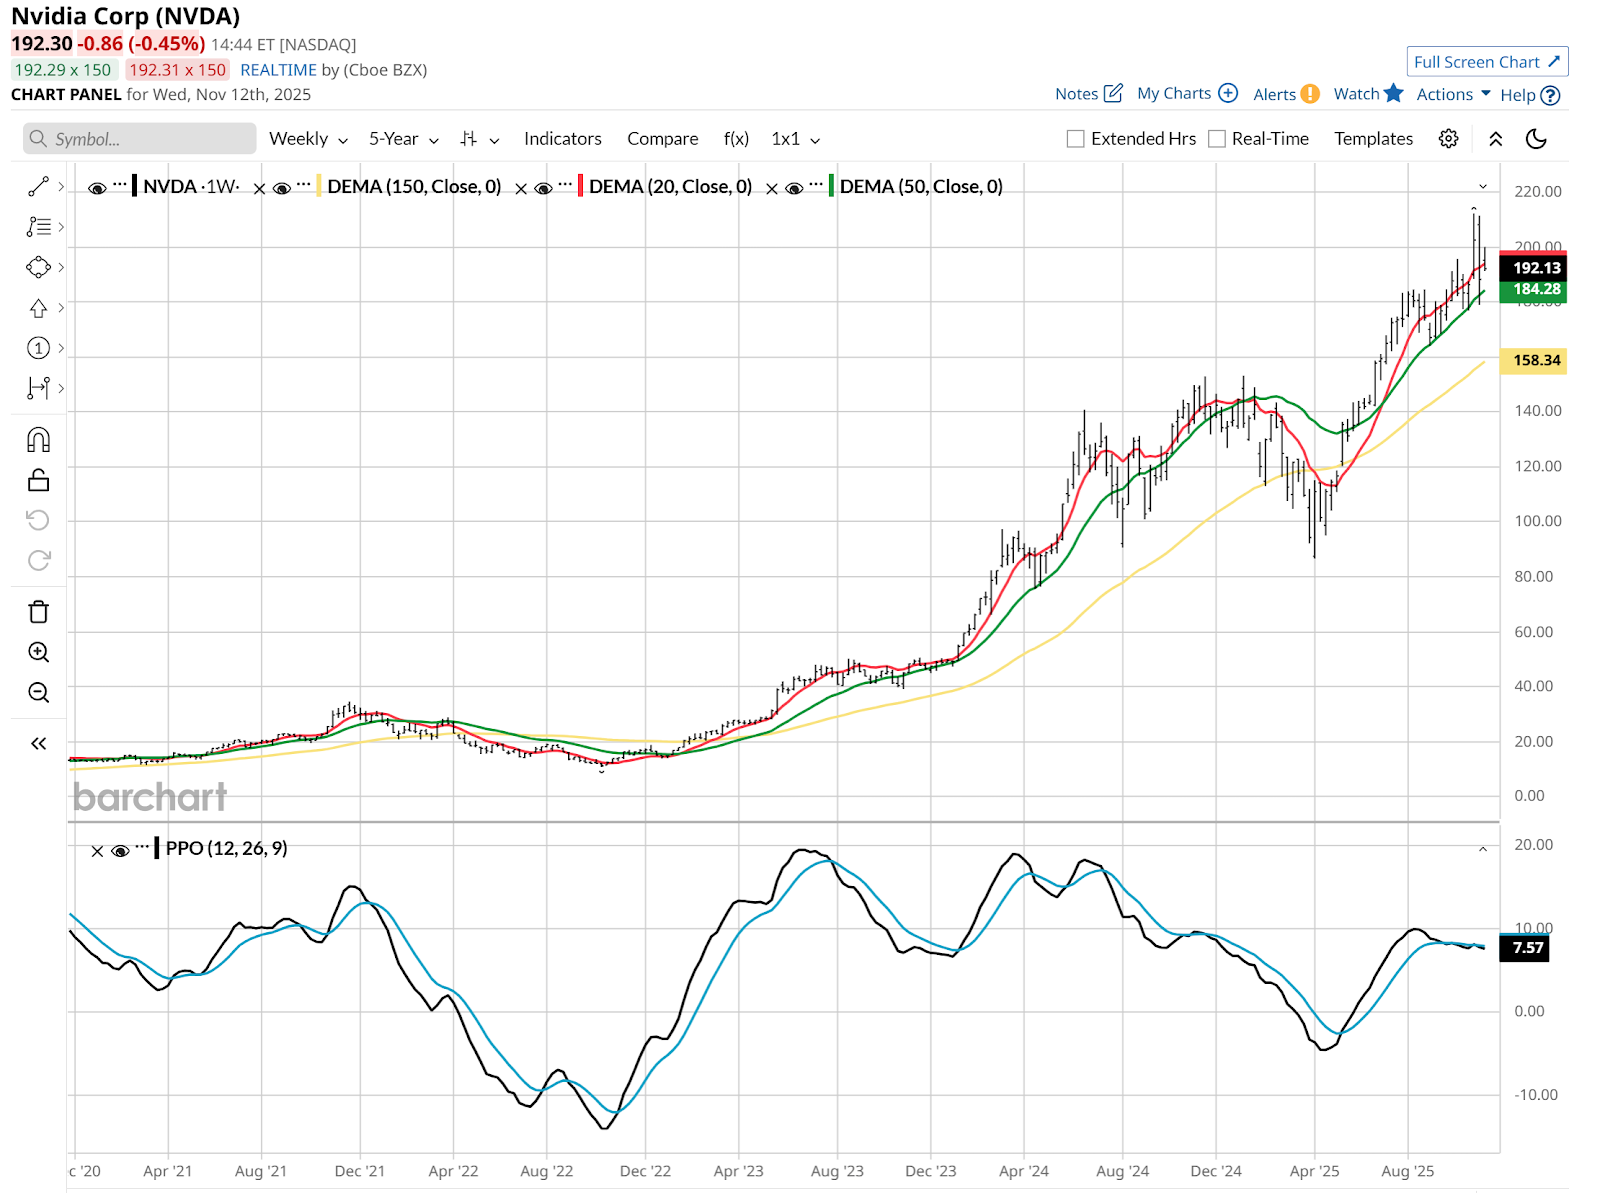
The weekly chart above shows a flattish Percentage Price Oscillator (PPO) indicator on the bottom, which is a signal to me that upward momentum has stopped. But given the critical importance of NVDA to the stock market and the AI trade in particular, there’s a good chance it is simply resting.
How to Trade NVDA Now
If I’m collaring a stock like this, which is the closest thing the market has to a “long-term asset” according to its fans, I am looking beyond a few months out. And, I’m looking to take advantage of stock’s recent malaise, to try to position for the next up leg. If that doesn’t happen, I will secure a worst-case scenario. That’s the mentality I use with collars.
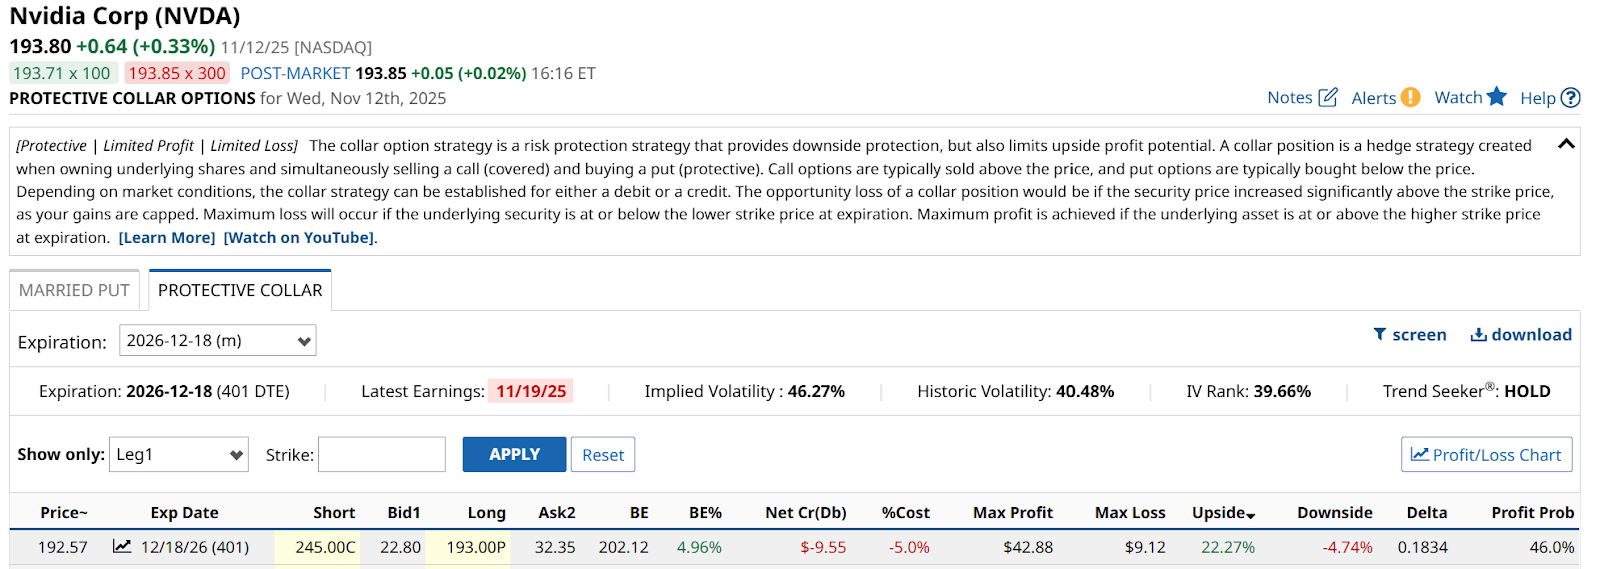
That landed me on this example as of Wednesday’s close. The put strike is right under the stock’s price, at $193. I’m going out to Dec. 18, 2026, so more than 13 months. And I can get upside all the way to $245.
Summary: 22% upside potential versus less than 5% downside risk. No matter what, over that time frame, from the current level. The cost is 5%, but over a period this long, with a stock like this, that’s somewhat immaterial to me. If NVDA doesn’t rally more than 5% in 13 months to cover the cost of the collar, the market has bigger issues. And those puts will look very nice.
If NVDA goes up through $5 trillion and $6 trillion and more during this time frame, I’ll be happy to have held the stock. And the inconvenience of capping my gains at $245 is offset by the ability I have to buy more stock, buy call options, etc., if I want to participate in more upside beyond that.
The collar is useful in many places. But in this market, for this stock, it is one of the better risk-reward tradeoffs I see currently.
On the date of publication, Rob Isbitts did not have (either directly or indirectly) positions in any of the securities mentioned in this article. All information and data in this article is solely for informational purposes. For more information please view the Barchart Disclosure Policy here.
More news from Barchart
- Nvidia Stock Is a High-Stakes Trade Ahead of November 19. How to Hedge the Risk of a Post-Earnings Plunge.
- United Airlines (UAL): Hidden Behind the Shutdown Deal is a Secret Informational Arbitrage Opportunity
- AMD’s $350 Price Target Is In: This Options Trade Is the Data-Driven Winner
- Double Your Dividends with this Options Strategy on Omega Healthcare


