In a severe incident earlier this month, MGM Resorts International (MGM) was crippled by a cyberattack affecting its operations. A hacking group named Scattered Spider brought down the systems of MGM, leading to several systems remaining paralyzed for a few days. This critical downtime forced the company to shut down selected operations to manage the issue. Consequential losses from the onslaught could very well be sizable.
According to Jefferies gaming industry analyst David Katz, the company is projected to face a near-term loss between 10% and 20% in revenue and cash flow “for the days that the current conditions exist.”
Adding to MGM’s predicament are class action lawsuits lodged against the company. The allegations accuse the organization of neglecting to protect its customer base from cyberattacks experienced this month.
This combination of factors could exert intense downward pressure on MGM’s stock price, making it potentially ill-advised for investors to invest in the stock now. In order to evaluate the situation better, we must scrutinize its key metrics further.
Examining the Financial Performance and Prospects of MGM Resorts International from 2020 to 2023
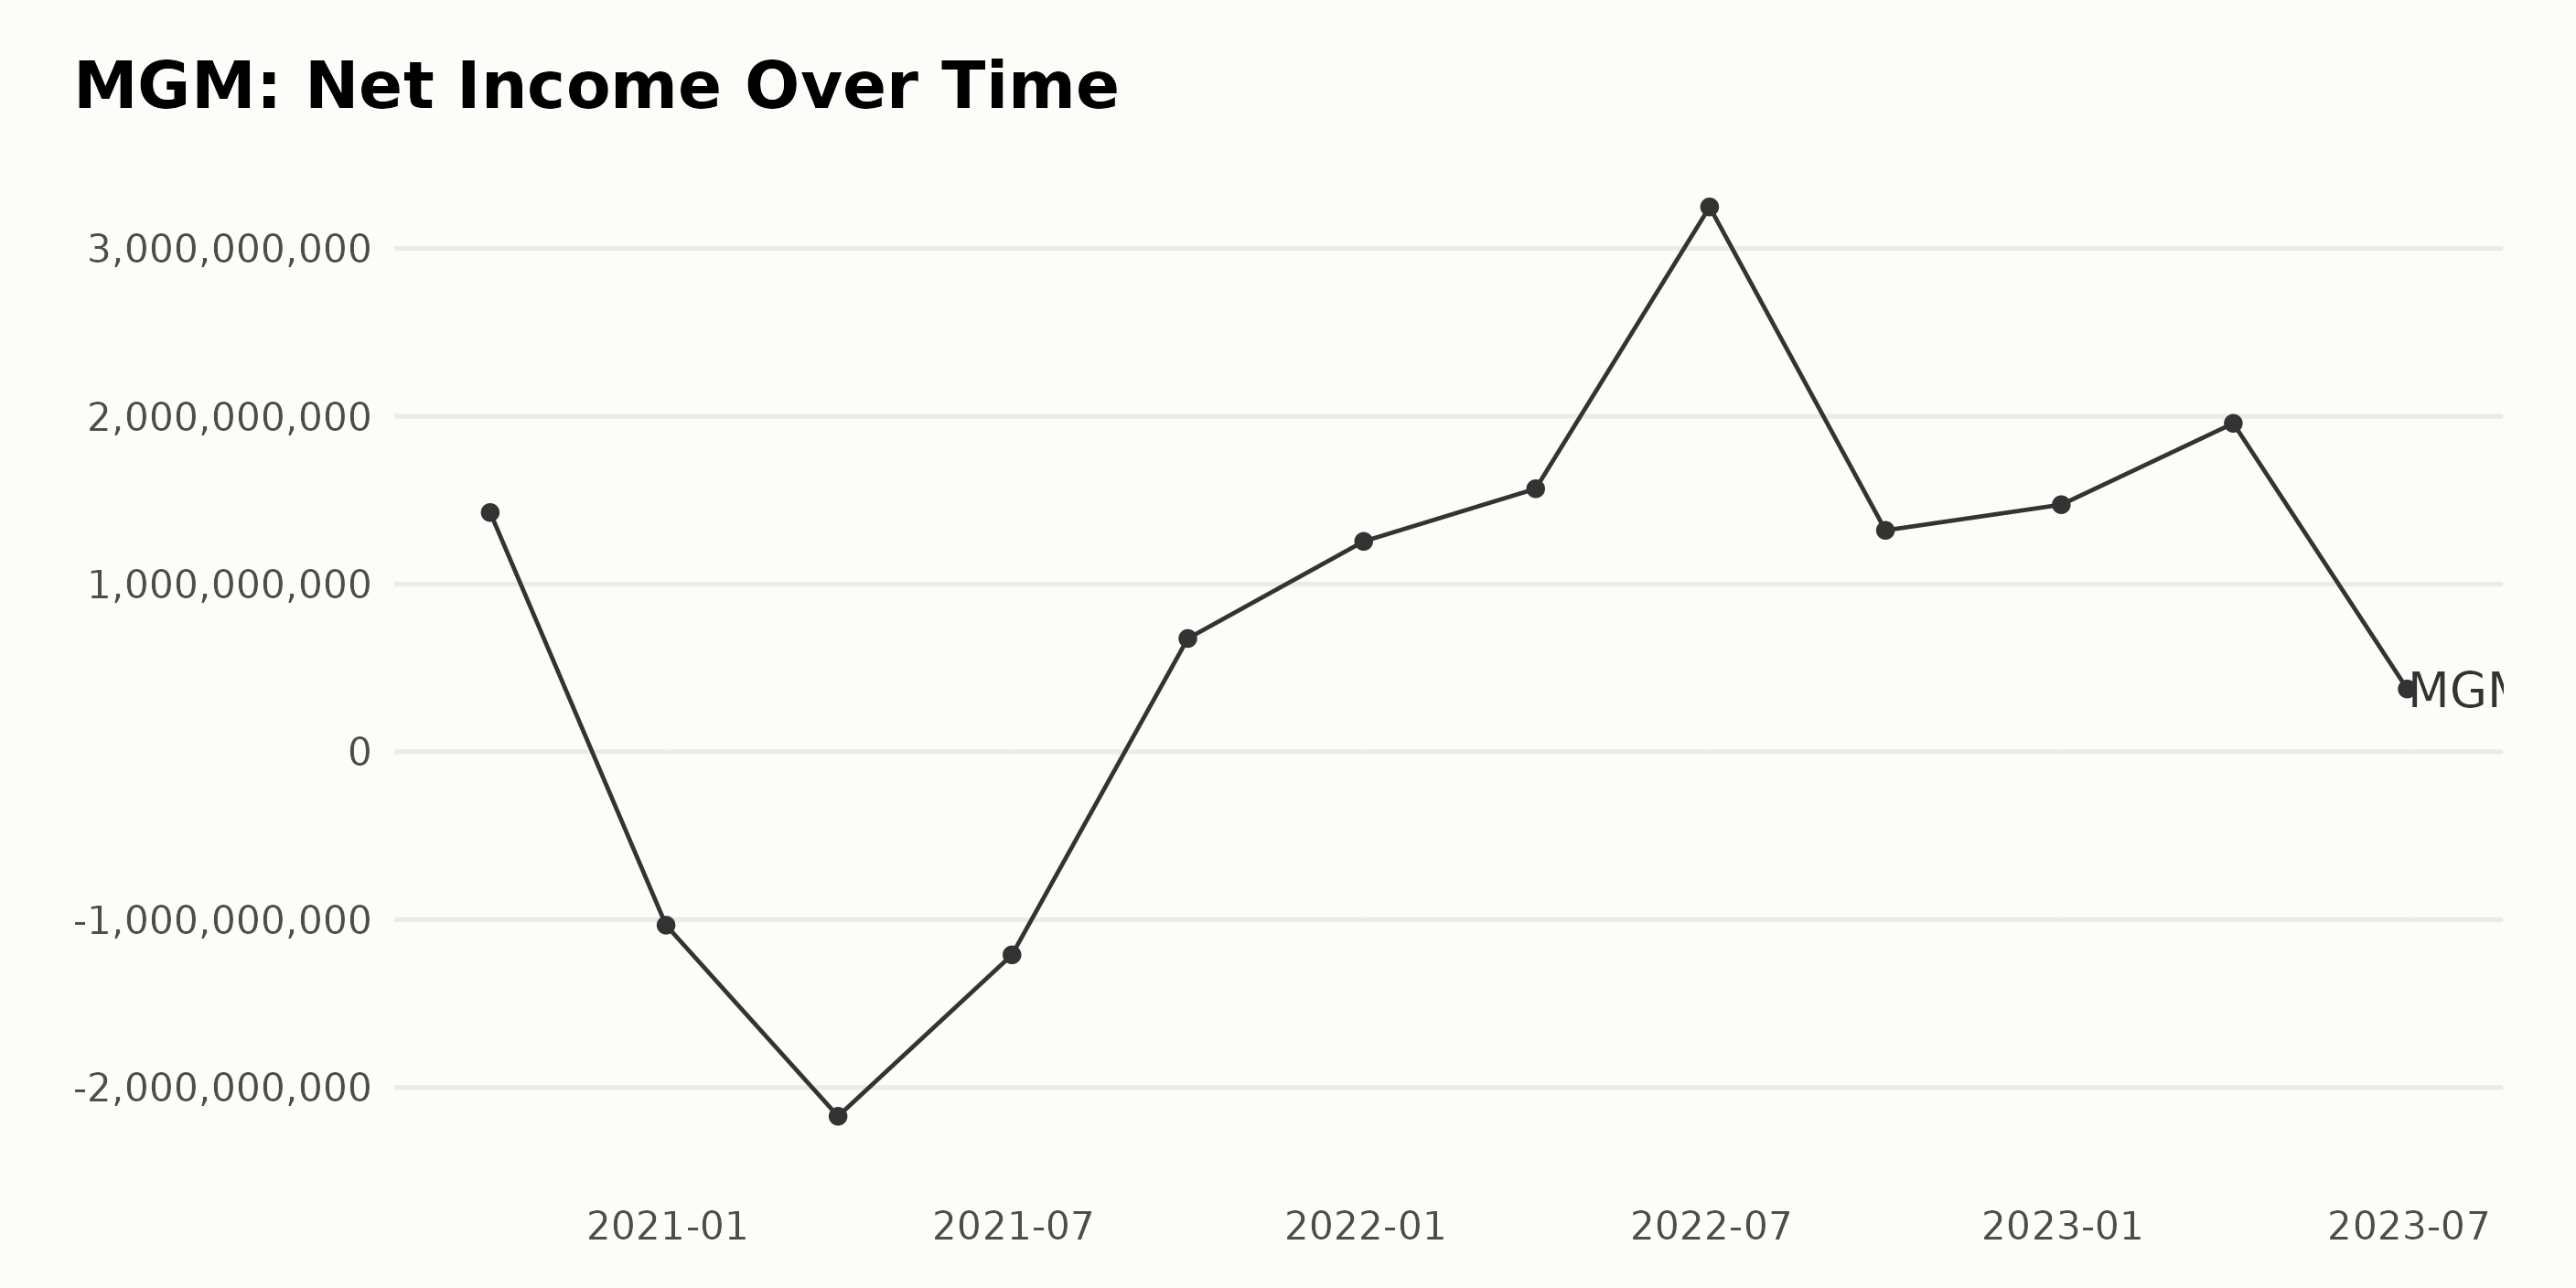
The trailing-12-month net income for MGM has exhibited several fluctuations while maintaining a general upward trend from 2020 to 2023.
- On September 30, 2020, MGM registered a net income of $1.43 billion.
- It then decreased dramatically, reporting negative profits in December 2020, March 2021, and June 2021 at -$1.03 billion, -$2.17 billion, and -$1.21 billion, respectively.
- Net income rebounded on September 30, 2021, with positive earnings of $676 million; subsequently, it remained positive and grew substantially throughout 2022.
- The peak came in June 2022 at $3.25 billion, after which there was a decrease to $1.32 billion in September 2022 and a slight increase to $1.47 billion by the end of 2022.
- In 2023, net income started strong at $1.96 billion in March but dropped drastically to $375 million in June 2023, which is the last data point in this series.
This summary represents a tremendous overall growth rate, as the net income changed from an initial value of $1.43 billion in September 2020 to $375 million in June 2023. While there were periods of negative net income, the company has recovered and grown significantly, with a notable high point in June 2022 when the net income reached $3.25 billion. However, the most recent data from June 2023 shows a considerable dip to $375 million, which suggests a downward shift at the end of the series.
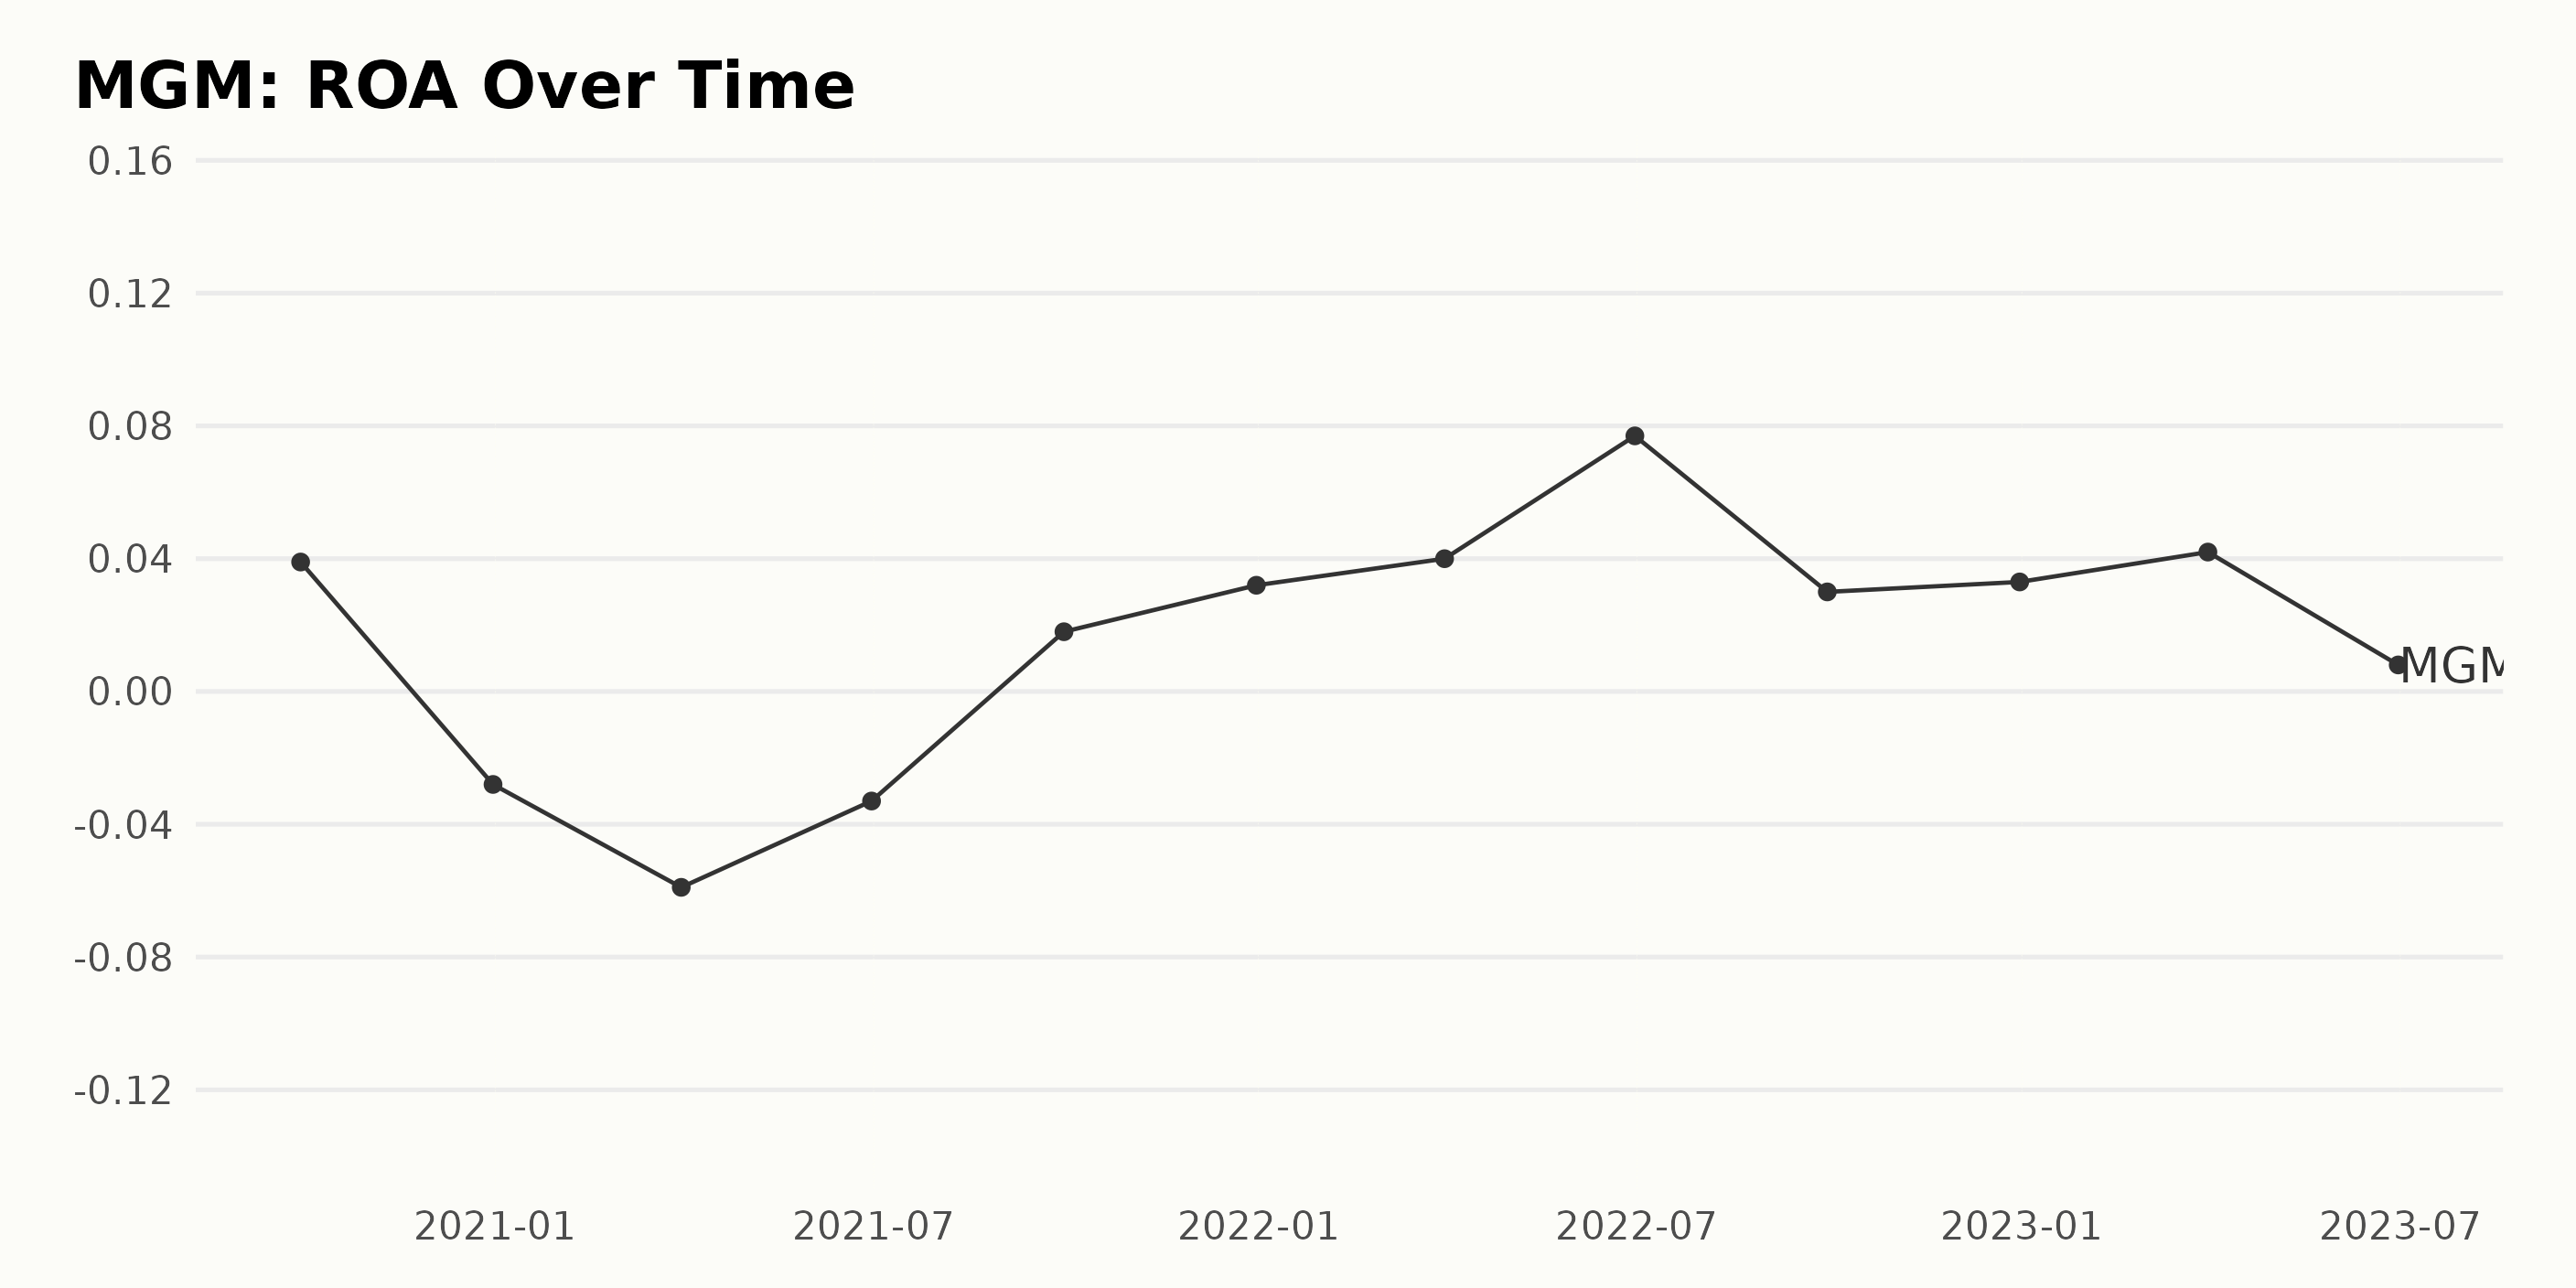
The ROA of MGM has displayed a fluctuating trend from September 2020 to June 2023.
- In September 2020, the ROA was 3.9%
- By the end of the year (December 2020), we observed a decline in the value to -2.8%
- This downward trend continued into March 2021, hitting a low of -5.9%
- While the ROA improved slightly to -3.3% by June 2021, it finally reverted back to positive in September 2021 at 1.8%
Recent fluctuations From September 2021 onwards, we’ve seen a general upward trend overall, although there have still been fluctuations within that period.
- The ROA continually increased from 1.8% in September 2021 peaked at 7.7% in June 2022 before experiencing a significant drop to 3% in September 2022.
- However, this was followed by a smaller incremental increase to 3.3% by the end of December 2022.
- The ROA value as of the last point in the data series (June 2023) recorded a significant decrease to 0.8% - showing the lowest value for the year so far.
Growth rate calculation When comparing the first value of the series (3.9% in September 2020) with the last value (0.8% in June 2023), we witness a negative growth rate of approximately 307% over the period under review. This indicates a significant contraction in the ROA for MGM Resorts International.
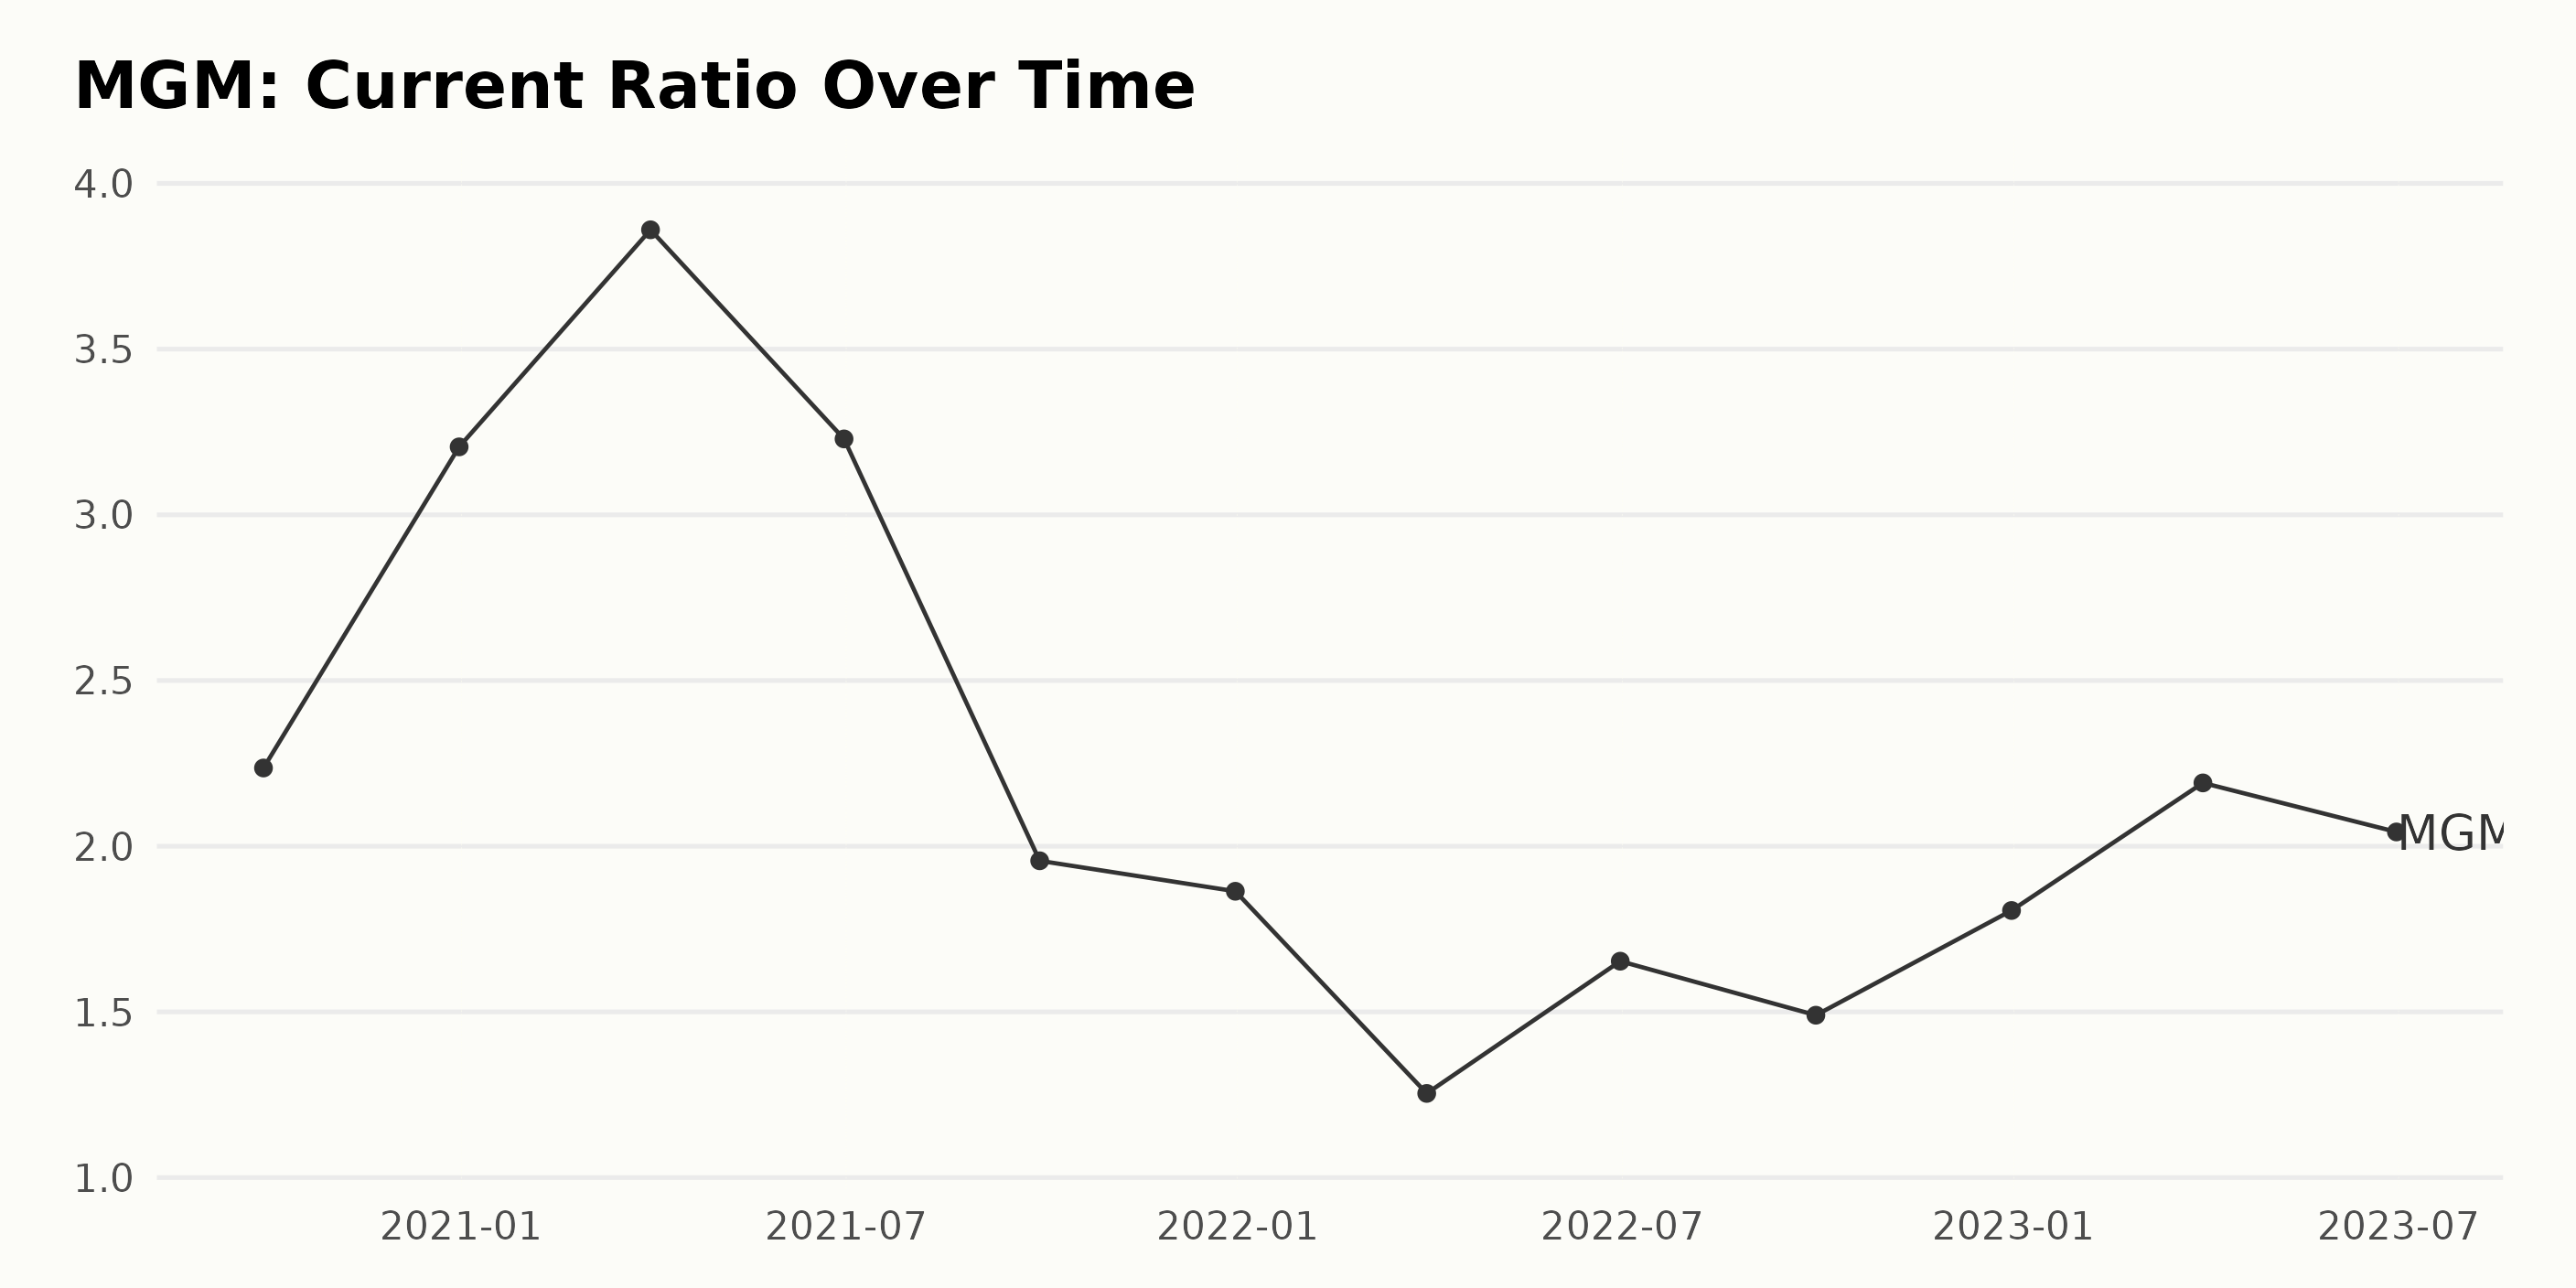
The following insights can be derived from the given data relating to MGM’s Current Ratio over the period of 2020 through 2023:
- At its start in September 2020, the Current Ratio stood at 2.24.
- It had its largest increase in a single quarter between September and December 2020, going from 2.24 to 3.21, evidencing a robust growth during this period.
- The Current Ratio kept an upward trend reaching its highest value of 3.86 in March 2021, then it started a downward trend until the first quarter of 2022.
- The ratio hit its lowest value of 1.25 in March 2022, showing a significant drop of nearly 68% from its high point in March 2021.
- From the second quarter of 2022 to the second quarter of 2023, we see some fluctuation with an overall upward trend.
- The last available data point, in June 2023, shows a Current Ratio of 2.04, indicating a recovery trend from March 2022’s low.
The overall growth rate from the first reported data in September 2020 (2.24) to the latest in June 2023 (2.04) is -8.9%. This highlights a mild negative growth across the total review period despite several fluctuations in the interim.
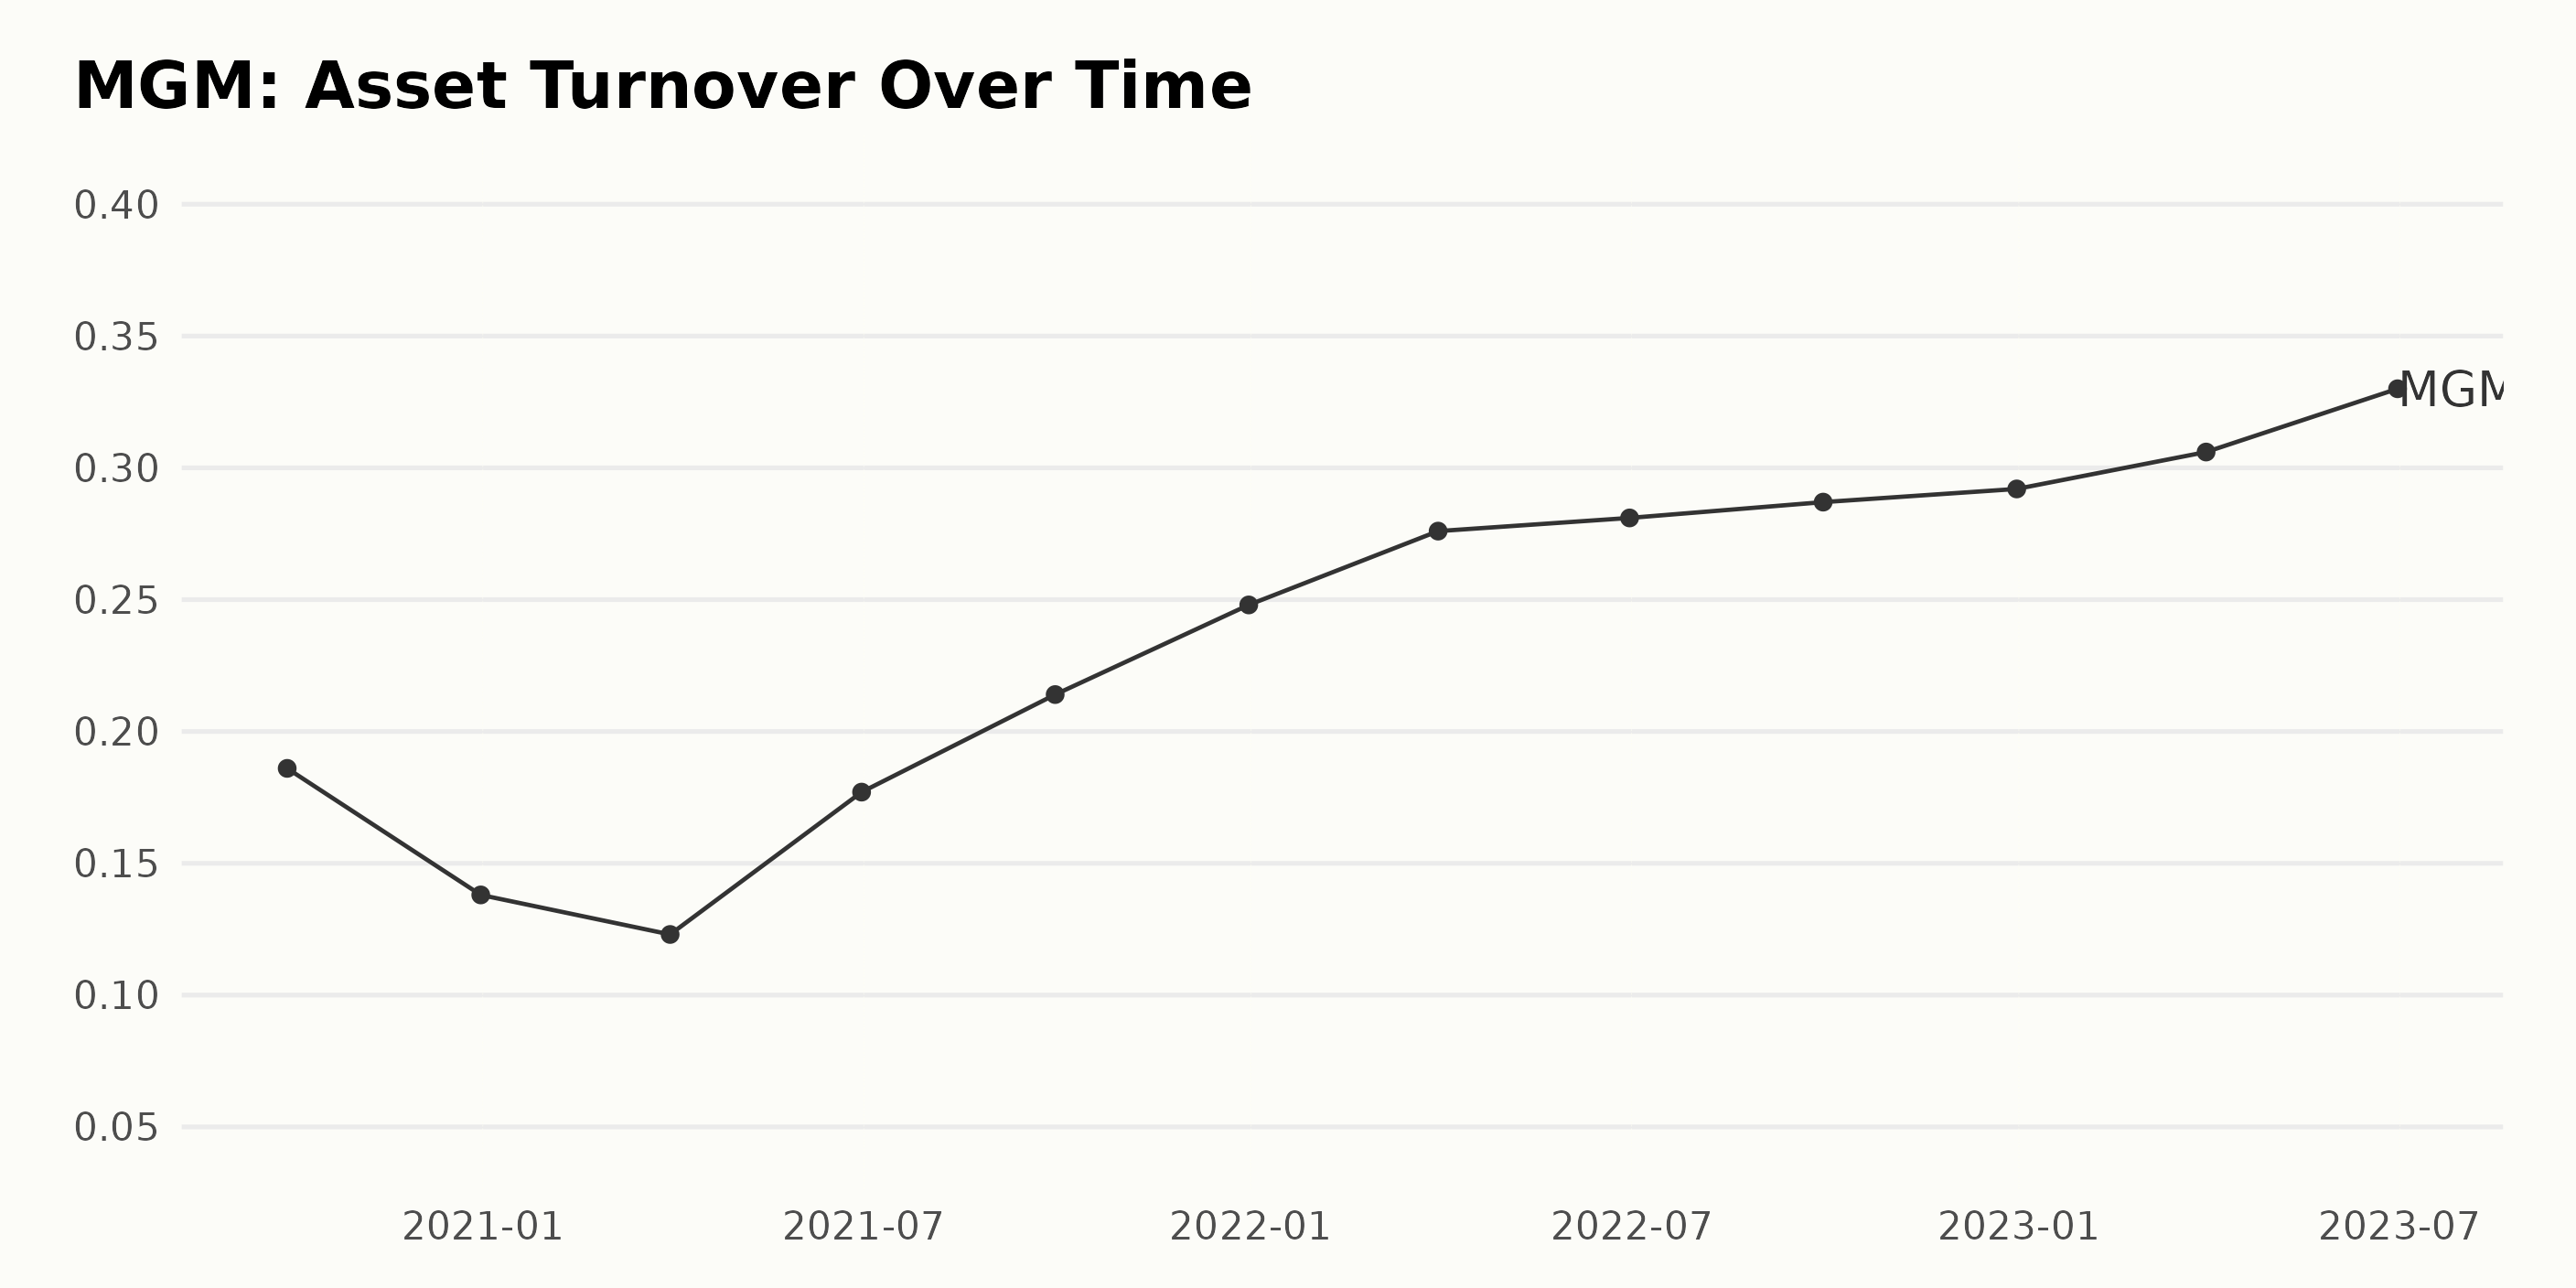
Based on the data provided, below are key insights into the Asset Turnover of MGM:
- Starting from September 2020, MGM had an Asset Turnover of 0.186. As of June 2023, the Asset Turnover reached 0.33. Using these two data points it shows a considerable growth rate in the company’s asset turnover.
- During the last quarter of 2020, the Asset Turnover dropped to 0.138, indicating a decrease in the efficiency of MGM’s asset utilization. But in the subsequent period, there has been a steady increase in Asset Turnover.
- In the first quarter of 2021, the Asset Turnover was 0.123, showing a slight decrease from the previous quarter.
- By the end of the second quarter in 2021, there was a substantial increase observed as the value rose to 0.177.
- By the end of the third quarter of 2021, a further increase in Asset Turnover was seen, with the value reaching 0.214.
- By the end of 2021, the Asset Turnover saw a consistent rise to 0.248.
Going into the year 2022:
- In the first quarter, the Asset Turnover increased further to 0.276.
- By the second quarter, the Asset Turnover had slightly improved to reach 0.281.
- The third-quarter of 2022 saw another minor rise in the Asset Turnover to 0.287.
- By the end of the fourth quarter, the year saw a steady increase, ending with an Asset Turnover value of 0.292.
For the year 2023:
- The first quarter showed a rise in the Asset Turnover to 0.306.
- As of June 2023 (the most recent data in the series), the Asset Turnover achieved its highest value in the series, reaching 0.33, showing a promising trend for MGM’s asset efficiency.
In summary, despite a few fluctuations, the trend of MGM’s Asset Turnover displayed a steady upward trend from September 2020 to June 2023. The company significantly improved its efficiency in utilizing its assets over this period.
Analyzing MGM Resorts’ 2023 Share Price Performance: Fluctuations and Trends Highlighted
The given data presents the share price performance of MGM Resorts International (MGM) across several months in 2023. Here is a summary of the trend and growth rate:
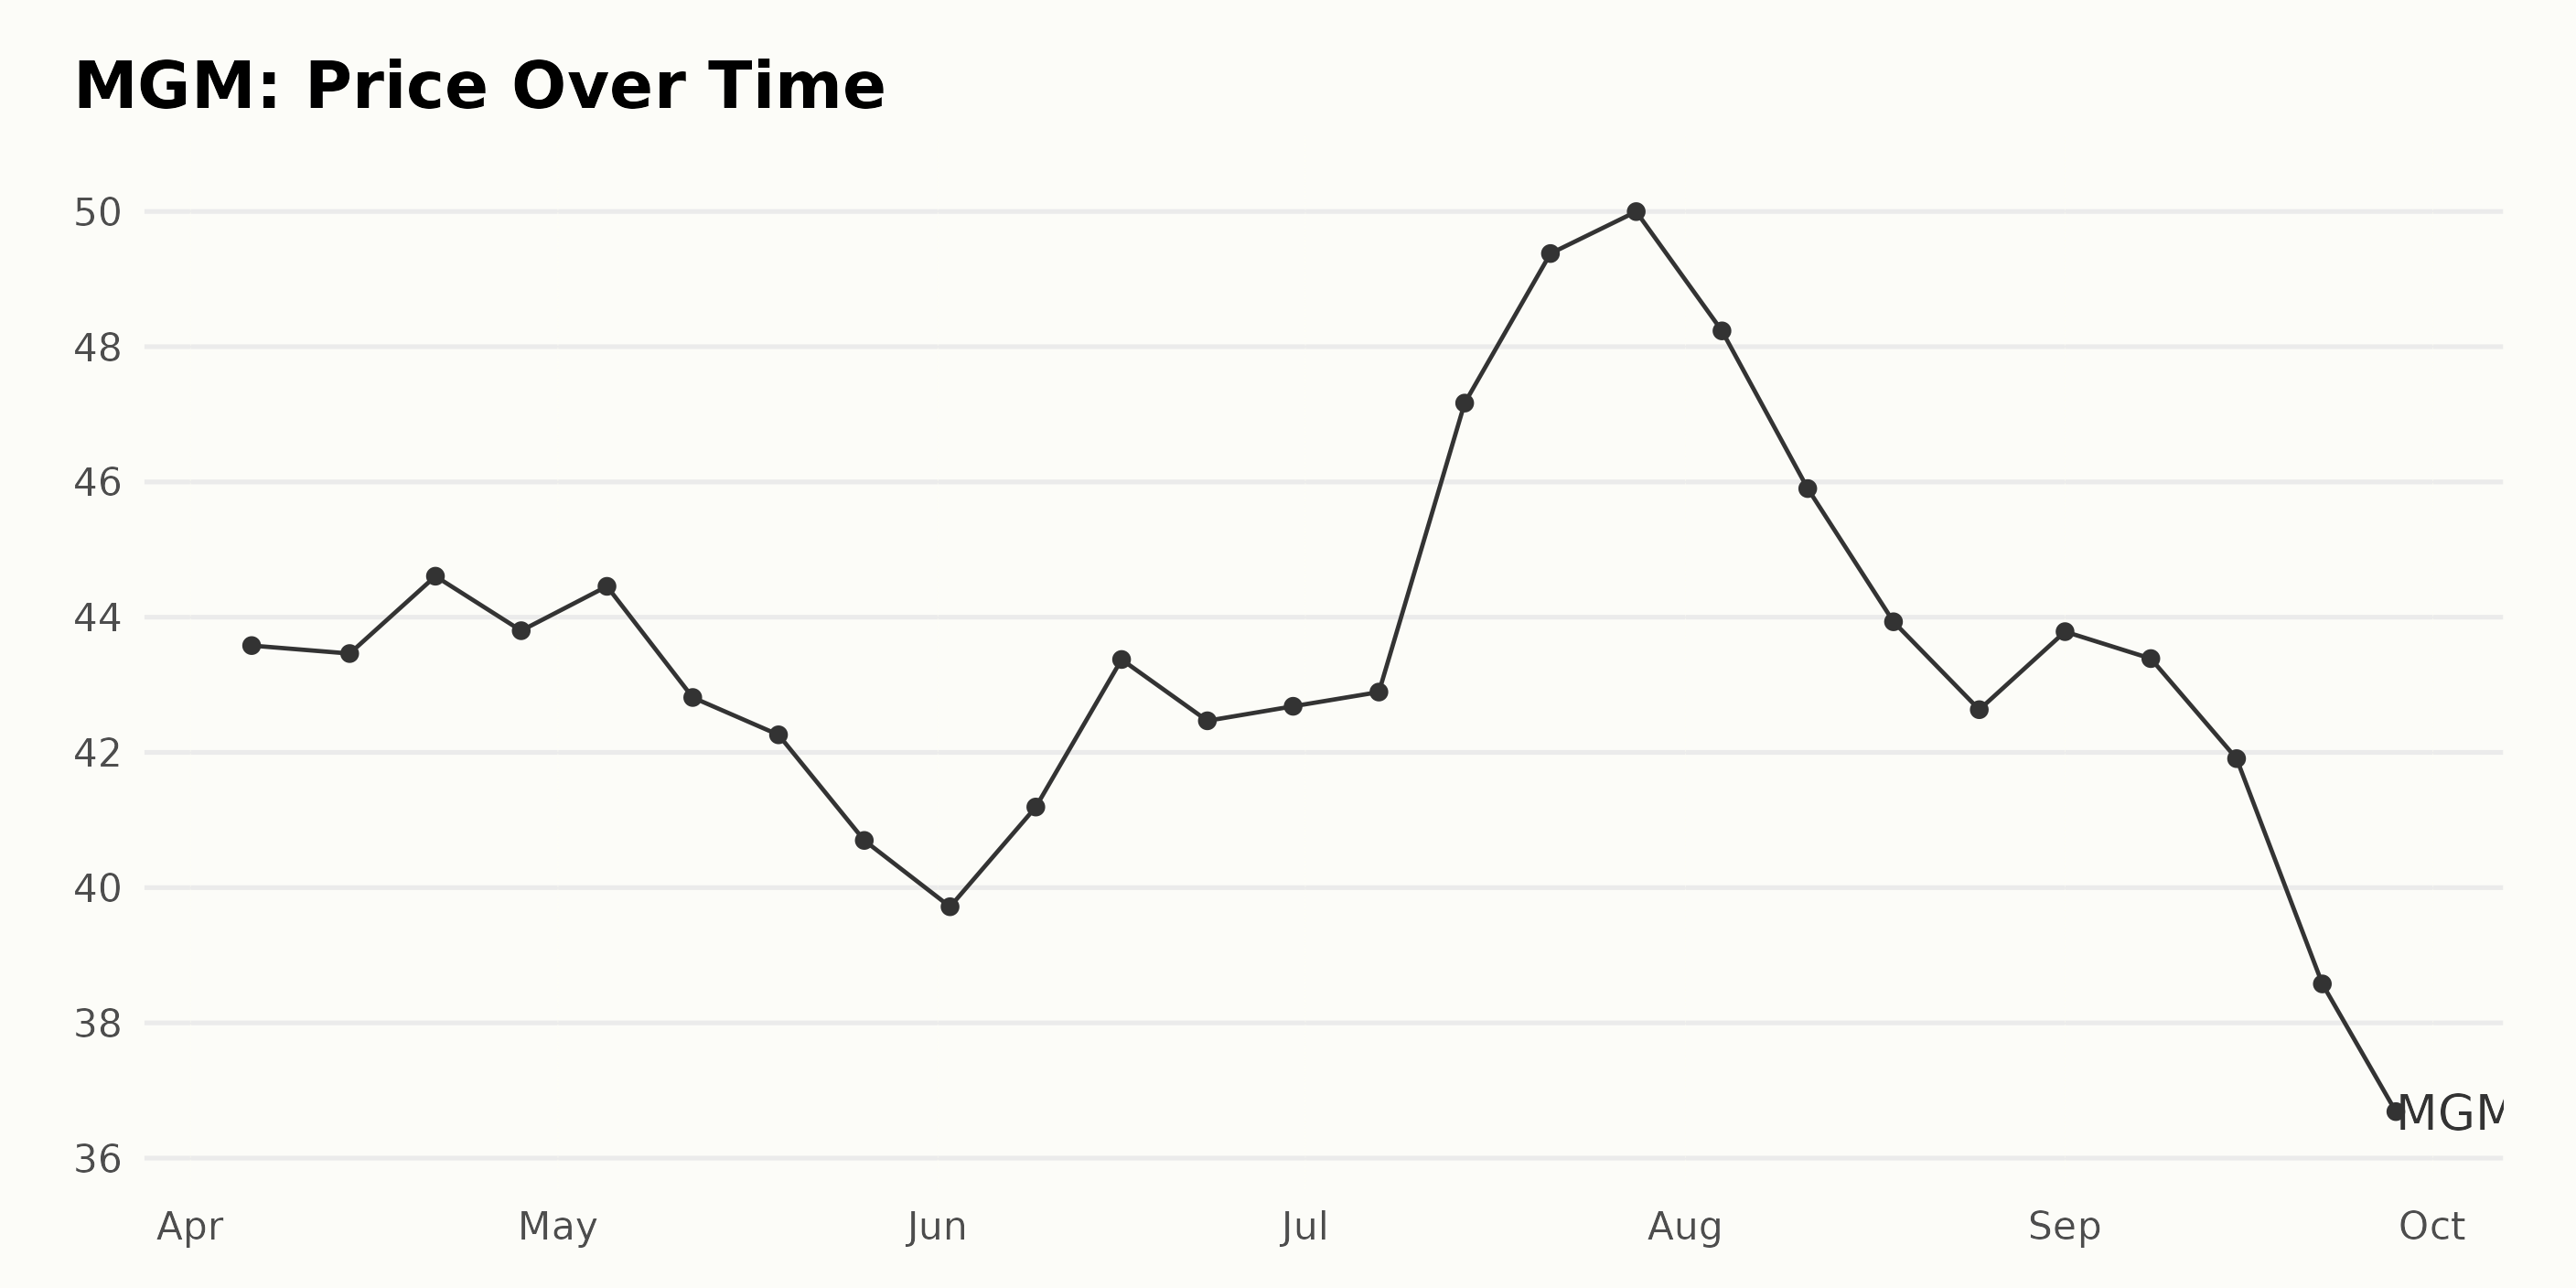
- April 2023: The share price begins at $43.58 on April 6 and ends with a slightly higher value of $43.8 by April 28. However, there is a slight fluctuation within the month.
- May 2023: There is a notable decrease in the share price throughout May, from $44.46 at the beginning of the month to $40.70 by the end of May. This implies a downtrend for this month.
- June 2023: June shows some signs of recovery, as the price bounces back from $39.72 on June 2 to $42.68 by June 30.
- July 2023: There is a significant upward trend in July, starting from $42.89 on July 7 and culminating at $49.99 by July 28.
- August 2023: In August, the process begins to reverse the previous month’s gains as it drops from $48.23 on August 4 to $42.63 by August 25.
- September 2023: The decline continues through September, moving from $43.79 on September 1 to $36.69 by the end of the month on September 28.
Overall, the MGM share price in 2023 experienced considerable fluctuations characterized by periods of upswing (especially in July) and downtrend (Particularly in May, August, and September). Here is a chart of MGM’s price over the past 180 days.
Analyzing MGM’s Performance: Focus on Momentum, Quality, and Value
MGM has an overall C rating, translating to a Neutral in our POWR Ratings system. It is ranked #10 out of the 27 stocks in the Entertainment - Casinos/Gambling category.
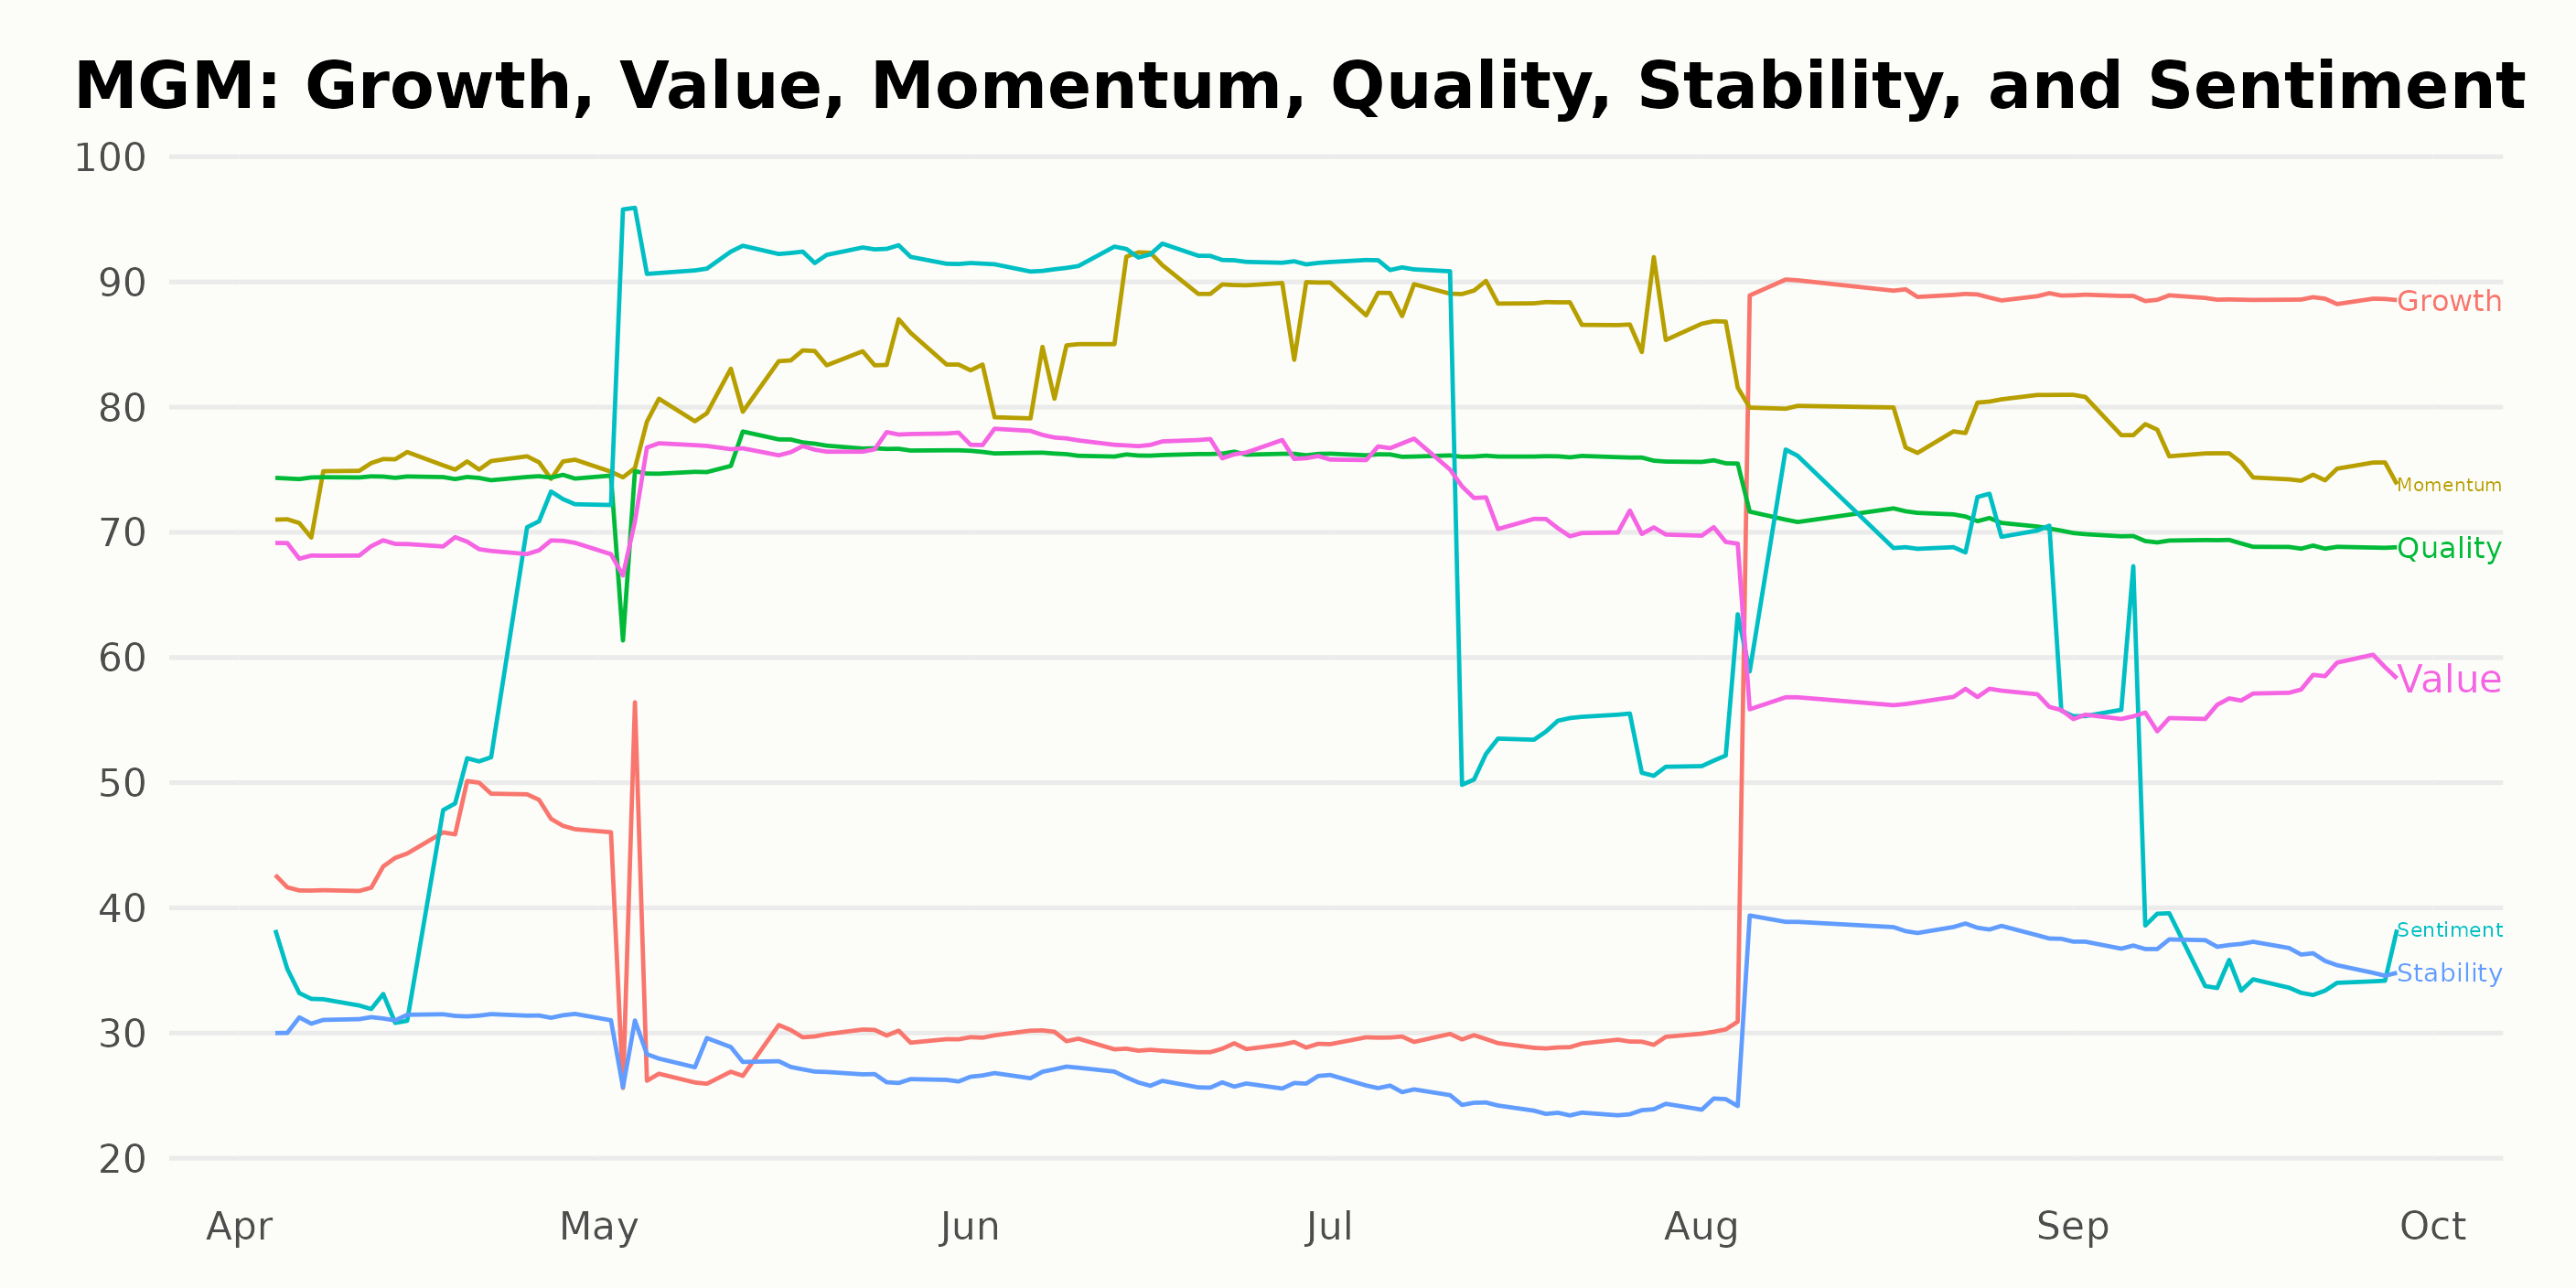
Among the POWR Ratings for MGM, the most noteworthy dimensions are Momentum, Quality, and Value. Please find below the analysis for these dimensions:
- Momentum: This dimension for MGM has been consistently high, with an evident upward trend. The Momentum score started at 74 in April 2023 and increased continually over the months, reaching its peak at 88 in July 2023, before settling down to 76 in September 2023. Despite a slight dip towards the end, the overall trend suggests continued growth and positive momentum for MGM.
- Quality: Quality is another high-rating dimension for MGM. It started off on par with Momentum at 74 in April 2023 and maintained in the mid-seventies until August 2023, showing consistency in the quality of MGM’s performance. However, there was a slight decrease to 69 in September 2023, indicating potential areas for improvement.
- Value: Value started strong at 69 in April 2023 and saw an upward trend till June 2023, peaking at 77. It made a significant drop to 60 in August 2023 and continued dipping to 57 by September 2023. This suggests that the perceived value of MGM might be decreasing over time despite some initial gains.
These three dimensions provide a holistic view of MGM’s performance, indicating strong momentum and consistent quality of operations, supplemented by an oscillating perception of value. This would be critical for understanding the company’s trajectory and areas of potential focus.
How does MGM Resorts International (MGM) Stack Up Against its Peers?
Other stocks in the Entertainment - Casinos/Gambling sector that may be worth considering are Inspired Entertainment Inc. (INSE), Monarch Casino & Resort Inc. (MCRI), and International Game Technology (IGT) -- they have better POWR Ratings.
What To Do Next?
43 year investment veteran, Steve Reitmeister, has just released his 2024 market outlook along with trading plan and top 11 picks for the year ahead.
MGM shares were trading at $36.77 per share on Friday afternoon, up $0.13 (+0.35%). Year-to-date, MGM has gained 9.66%, versus a 12.99% rise in the benchmark S&P 500 index during the same period.
About the Author: Subhasree Kar

Subhasree’s keen interest in financial instruments led her to pursue a career as an investment analyst. After earning a Master’s degree in Economics, she gained knowledge of equity research and portfolio management at Finlatics.
The post Is MGM Resorts International (MGM) Stock at Risk After Cyber Attack? appeared first on StockNews.com