Air passenger transportation services provider JetBlue Airways Corporation (JBLU) announced its plans to continue expanding in the United States and the Caribbean this month.
The company launched two new destinations to bring more low-fare, great-service flights to the airline’s customers. With all signs pointing to a busy summer travel season, the addition of new destinations should bode well for the company.
However, JBLU’s partnership with American Airlines Group Inc. (AAL), which got permission from the Trump administration in 2021, got under fire as the Biden administration sued the airlines in the same year. U.S. District Judge Leo Sorokin ruled that the companies’ Northeast Alliance (NEA) violated federal antitrust laws.
Recently, Judge Sorokin gave the airlines more time to unwind the deal. Additionally, the Justice Department opposed the airlines' request to keep some parts of the NEA, such as continuing to sell tickets on each other’s flights called code-sharing.
Given this backdrop, let’s look at the trends of some of JBLU’s key financial metrics to understand why it could be wise to wait for a better entry point in the stock.
Analyzing JetBlue's Financial Performance: Revenue and Key Ratios (June 2020 - March 2023)
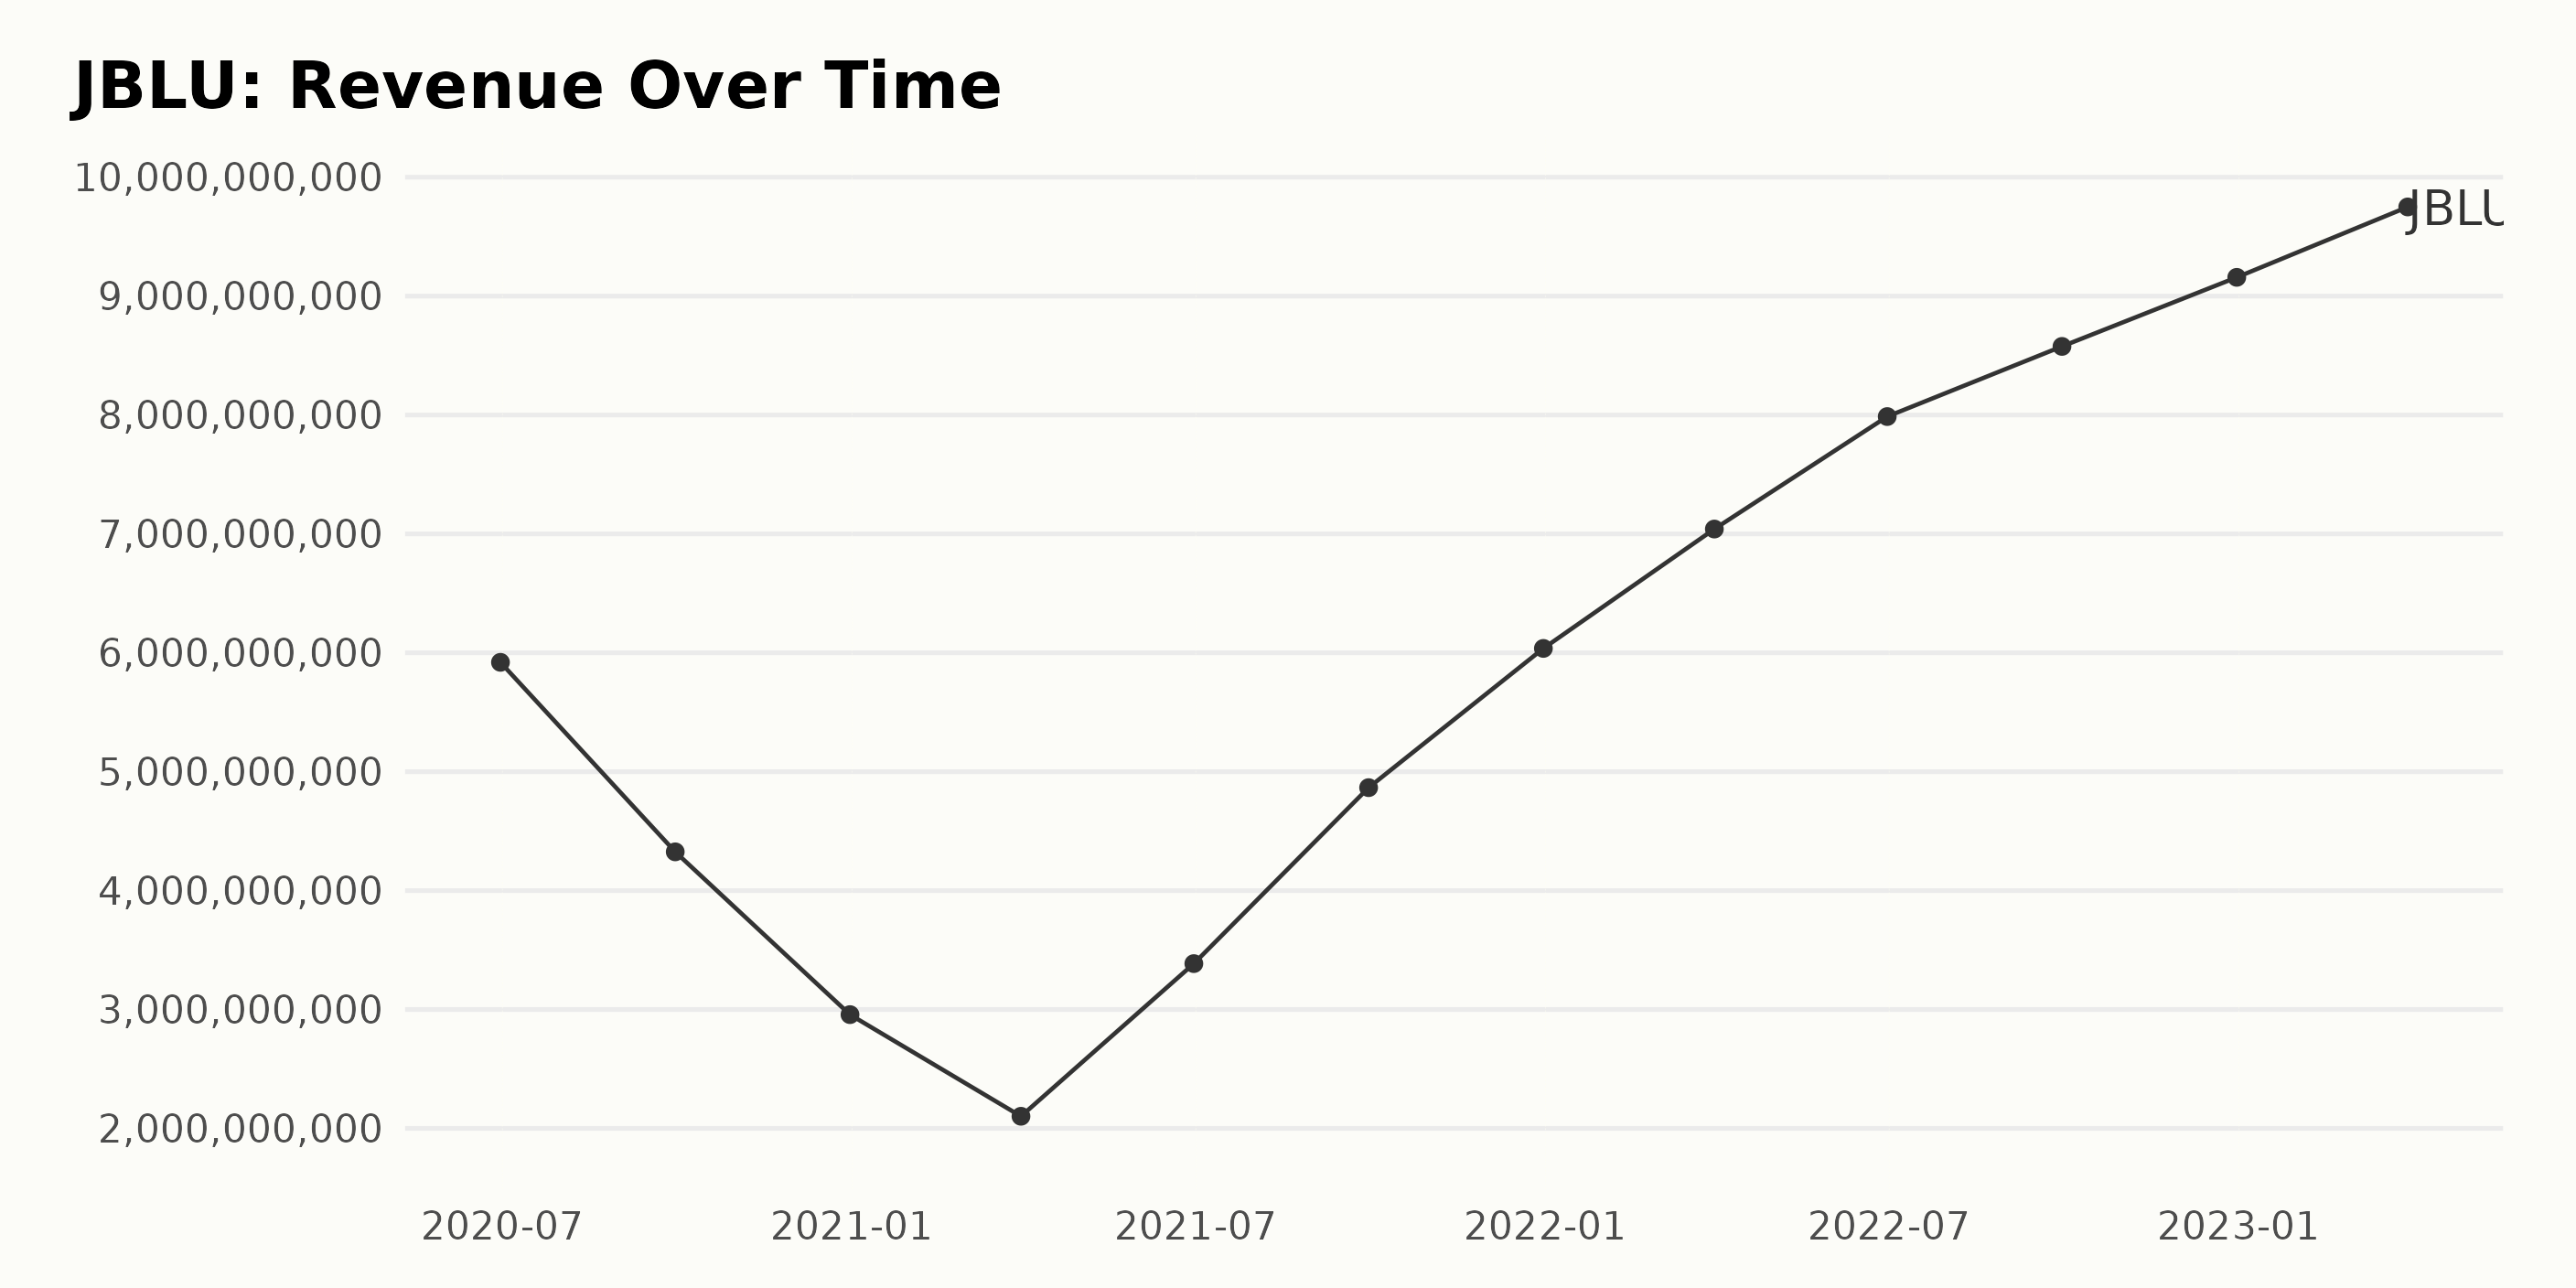
The trend and fluctuations in JBLU’s trailing-12-month revenue can be observed as follows:
- June 2020: $5.92 billion
- September 2020: $4.33 billion
- December 2020: $2.96 billion
- March 2021: $2.10 billion
- June 2021: $3.39 billion
- September 2021: $4.87 billion
- December 2021: $6.04 billion
- March 2022: $7.04 billion
- June 2022: $7.99 billion
- September 2022: $8.58 billion
- December 2022: $9.16 billion
- March 2023: $9.75 billion
Over the series, JBLU's revenue showed a general upward trend with some fluctuations. The revenue significantly dropped from June 2020 ($5.92 billion) to March 2021 ($2.10 billion).
Since then, it has been steadily increasing, reaching $9.75 billion by March 2023. Comparing the first value ($5.92 billion in June 2020) with the last value ($9.75 billion in March 2023), JBLU's revenue experienced a growth rate of approximately 65%. This highlights that it has significantly increased its revenue over time despite the fluctuations.
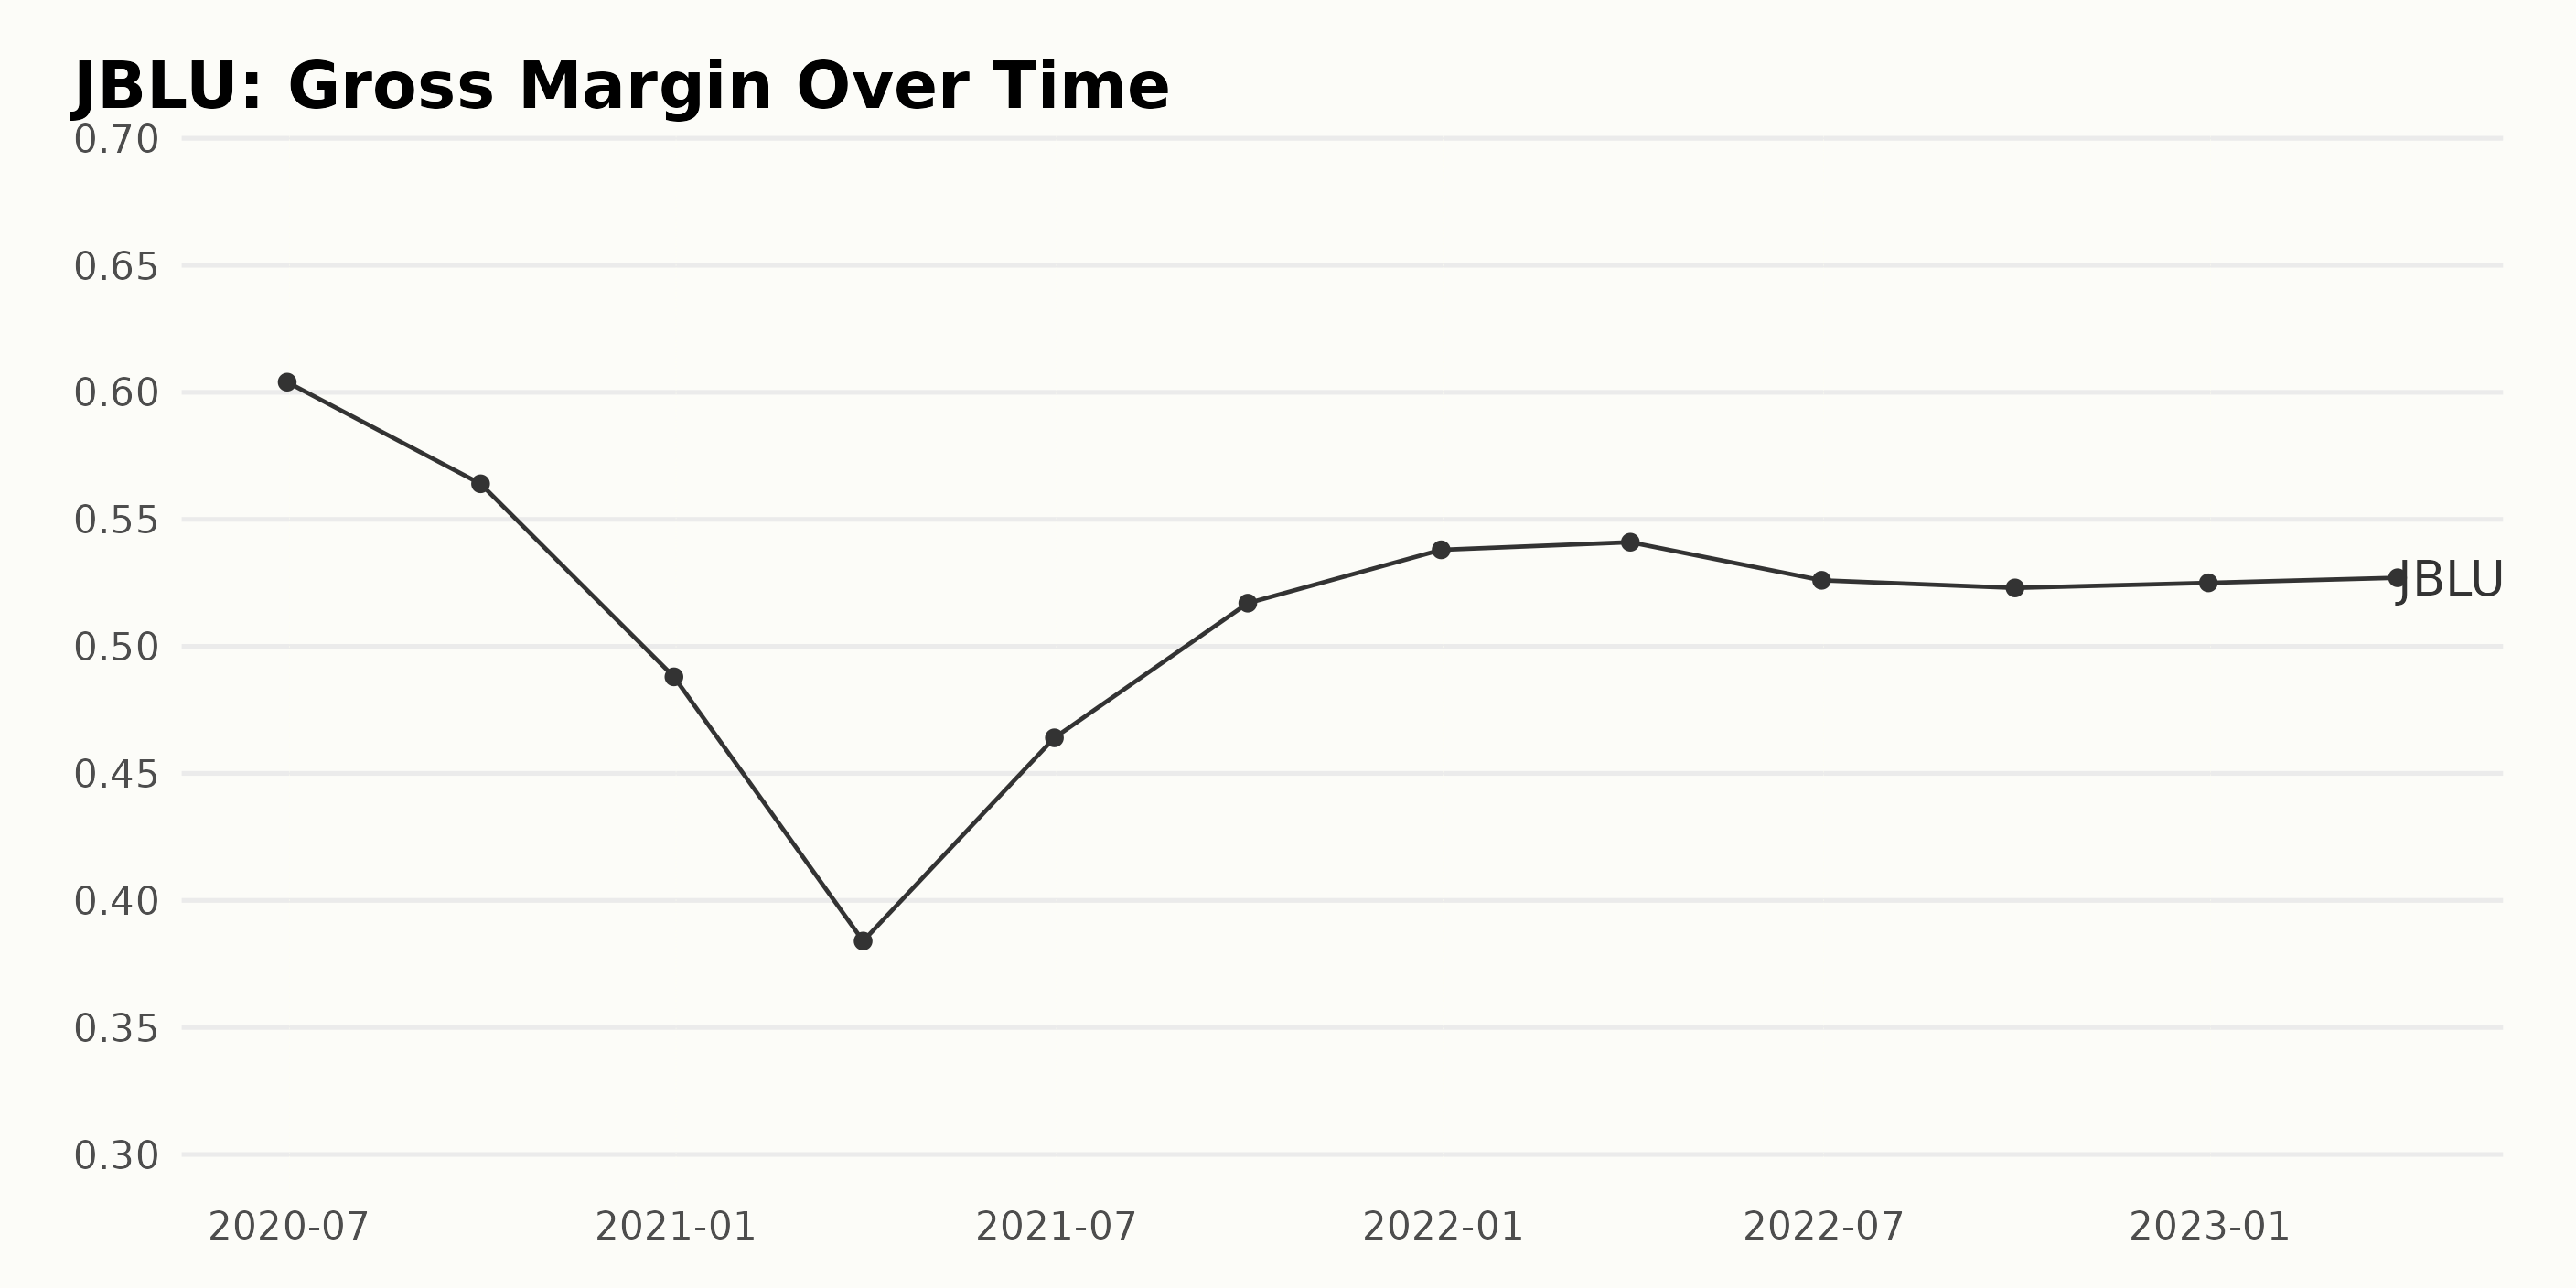
JBLU has experienced fluctuations in its trailing-12-month gross margin over the past few years. Here is a summary of the trend and fluctuations:
- June 2020: 60.40%
- September 2020: 56.40%
- December 2020: 48.80%
- March 2021: 38.40%
- June 2021: 46.40%
- September 2021: 51.70%
- December 2021: 53.80%
- March 2022: 54.10%
- June 2022: 52.60%
- September 2022: 52.30%
- December 2022: 52.50%
- March 2023: 52.70%
Based on the most recent data, JBLU's gross margin has seen an uptick since March 2021. It reached its highest value of 54.10% in March 2022 before experiencing a slight decline in the following months.
As of March 2023, JBLU's gross margin stands at 52.70%. Overall, JBLU’s gross margin has experienced a decline of approximately 12.7% from June 2020 to March 2023.
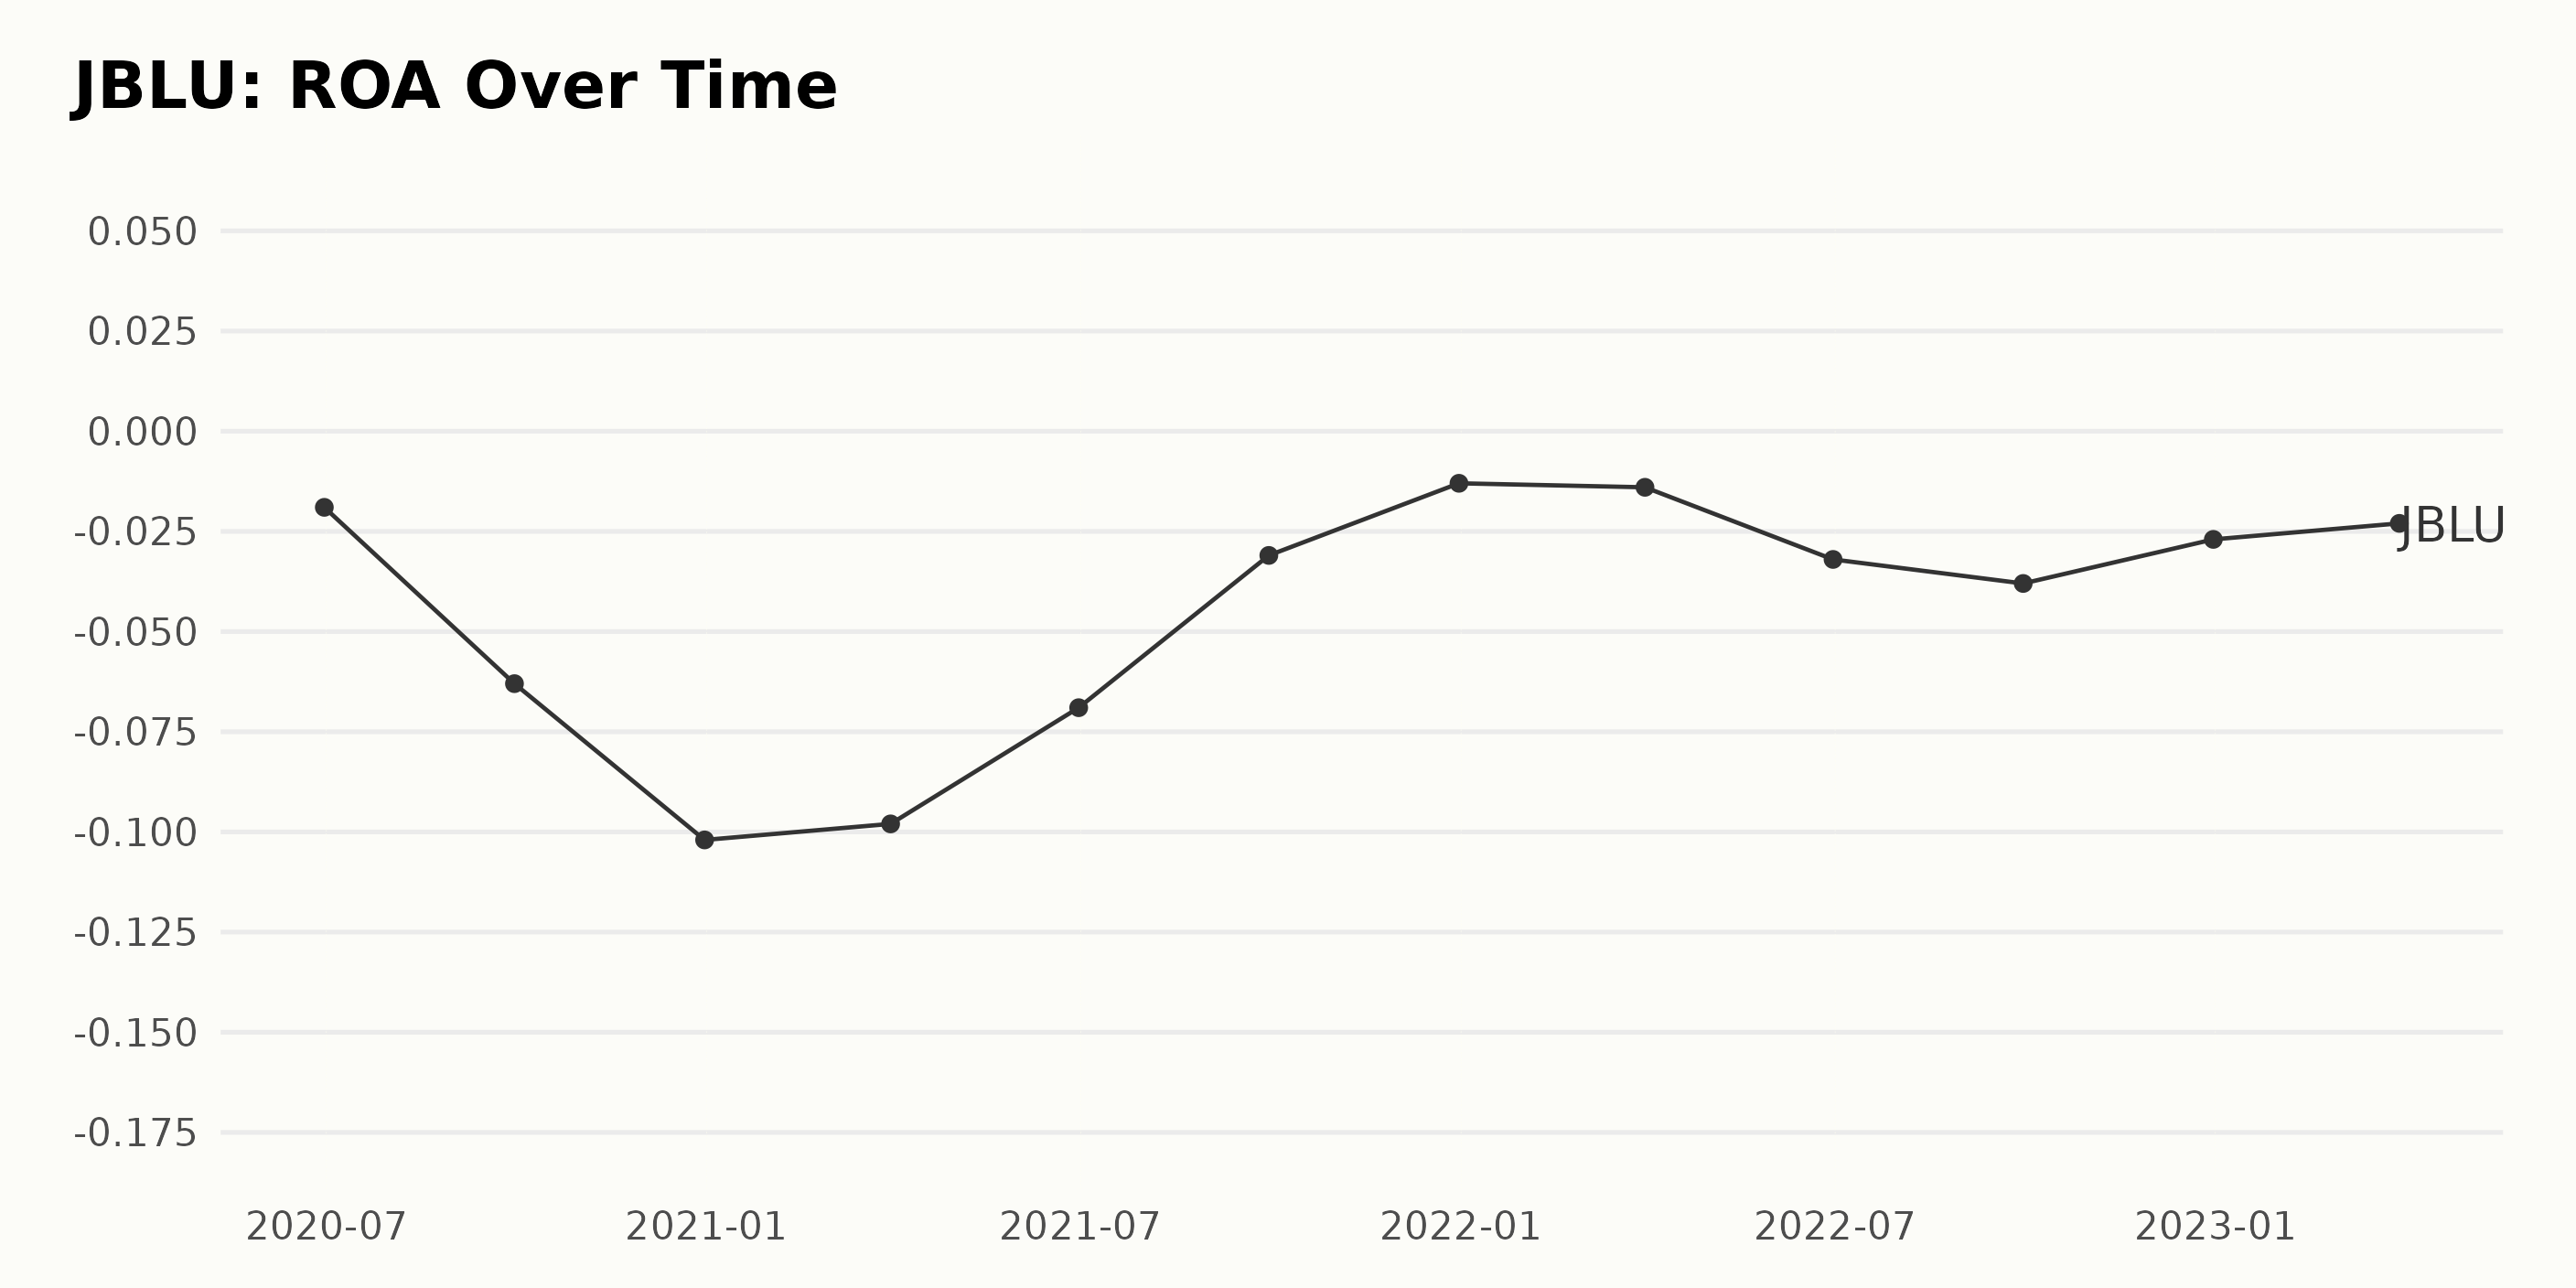
The trend and fluctuations in the Return on Assets (ROA) of JBLU are as follows: From June 2020 to December 2020, there was a notable decline in ROA, starting at -1.9% and reaching -10.2%.
In 2021, JBLU's ROA showed signs of recovery, moving from -9.8% in March to -3.1% in September. By the end of 2021, the ROA reached -1.3%, reflecting a positive trend in comparison to the previous values.
However, the first quarter of 2022 saw a slight increase in the negative value (-1.4%), followed by a dip to -3.2% in June and -3.8% in September. The ROA showed a slight improvement by the end of 2022, registering -2.7%. As of March 2023, the ROA stood at -2.3%.
In summary, JBLU’s ROA experienced a declining trend between June 2020 and December 2020 before witnessing a recovery throughout 2021. The recent fluctuations in 2022 indicated an unsettled performance, but with the last value standing at -2.3% (March 2023), there has been an overall growth rate of 0.6% since June 2020.
The JBLU analyst price target has experienced fluctuations over the period from November 2021 to June 2023. Below is a summary highlighting the key trends and data points:
The price target initially increased from $21.0 on November 12, 2021, to $21.2 on November 19, 2021, before stabilizing at $21 from November 26, 2021, until January 7, 2022. A slight dip was observed to $20.6 on January 21, 2022, followed by a decline to $20 until April 29, 2022, when it fell to $18.2.
From April 29, 2022, the target price experienced a consistent drop reaching its lowest point of $9 from April 21, 2023, onwards. Growth rate: Comparing the first value ($21.0) to the last value ($9.0), there is a decrease of approximately 57%. Notable data points:
- Peak: $21.2 on November 19, 2021
- Lowest point: $9.0 since April 21, 2023
Placing greater emphasis on more recent data and the last value, the analyst price target for JBLU has remained steady at $9 from April 21, 2023, till June 16, 2023.

Analyzing JBLU's Stock Performance: An Overview of Recent Trends and Fluctuations
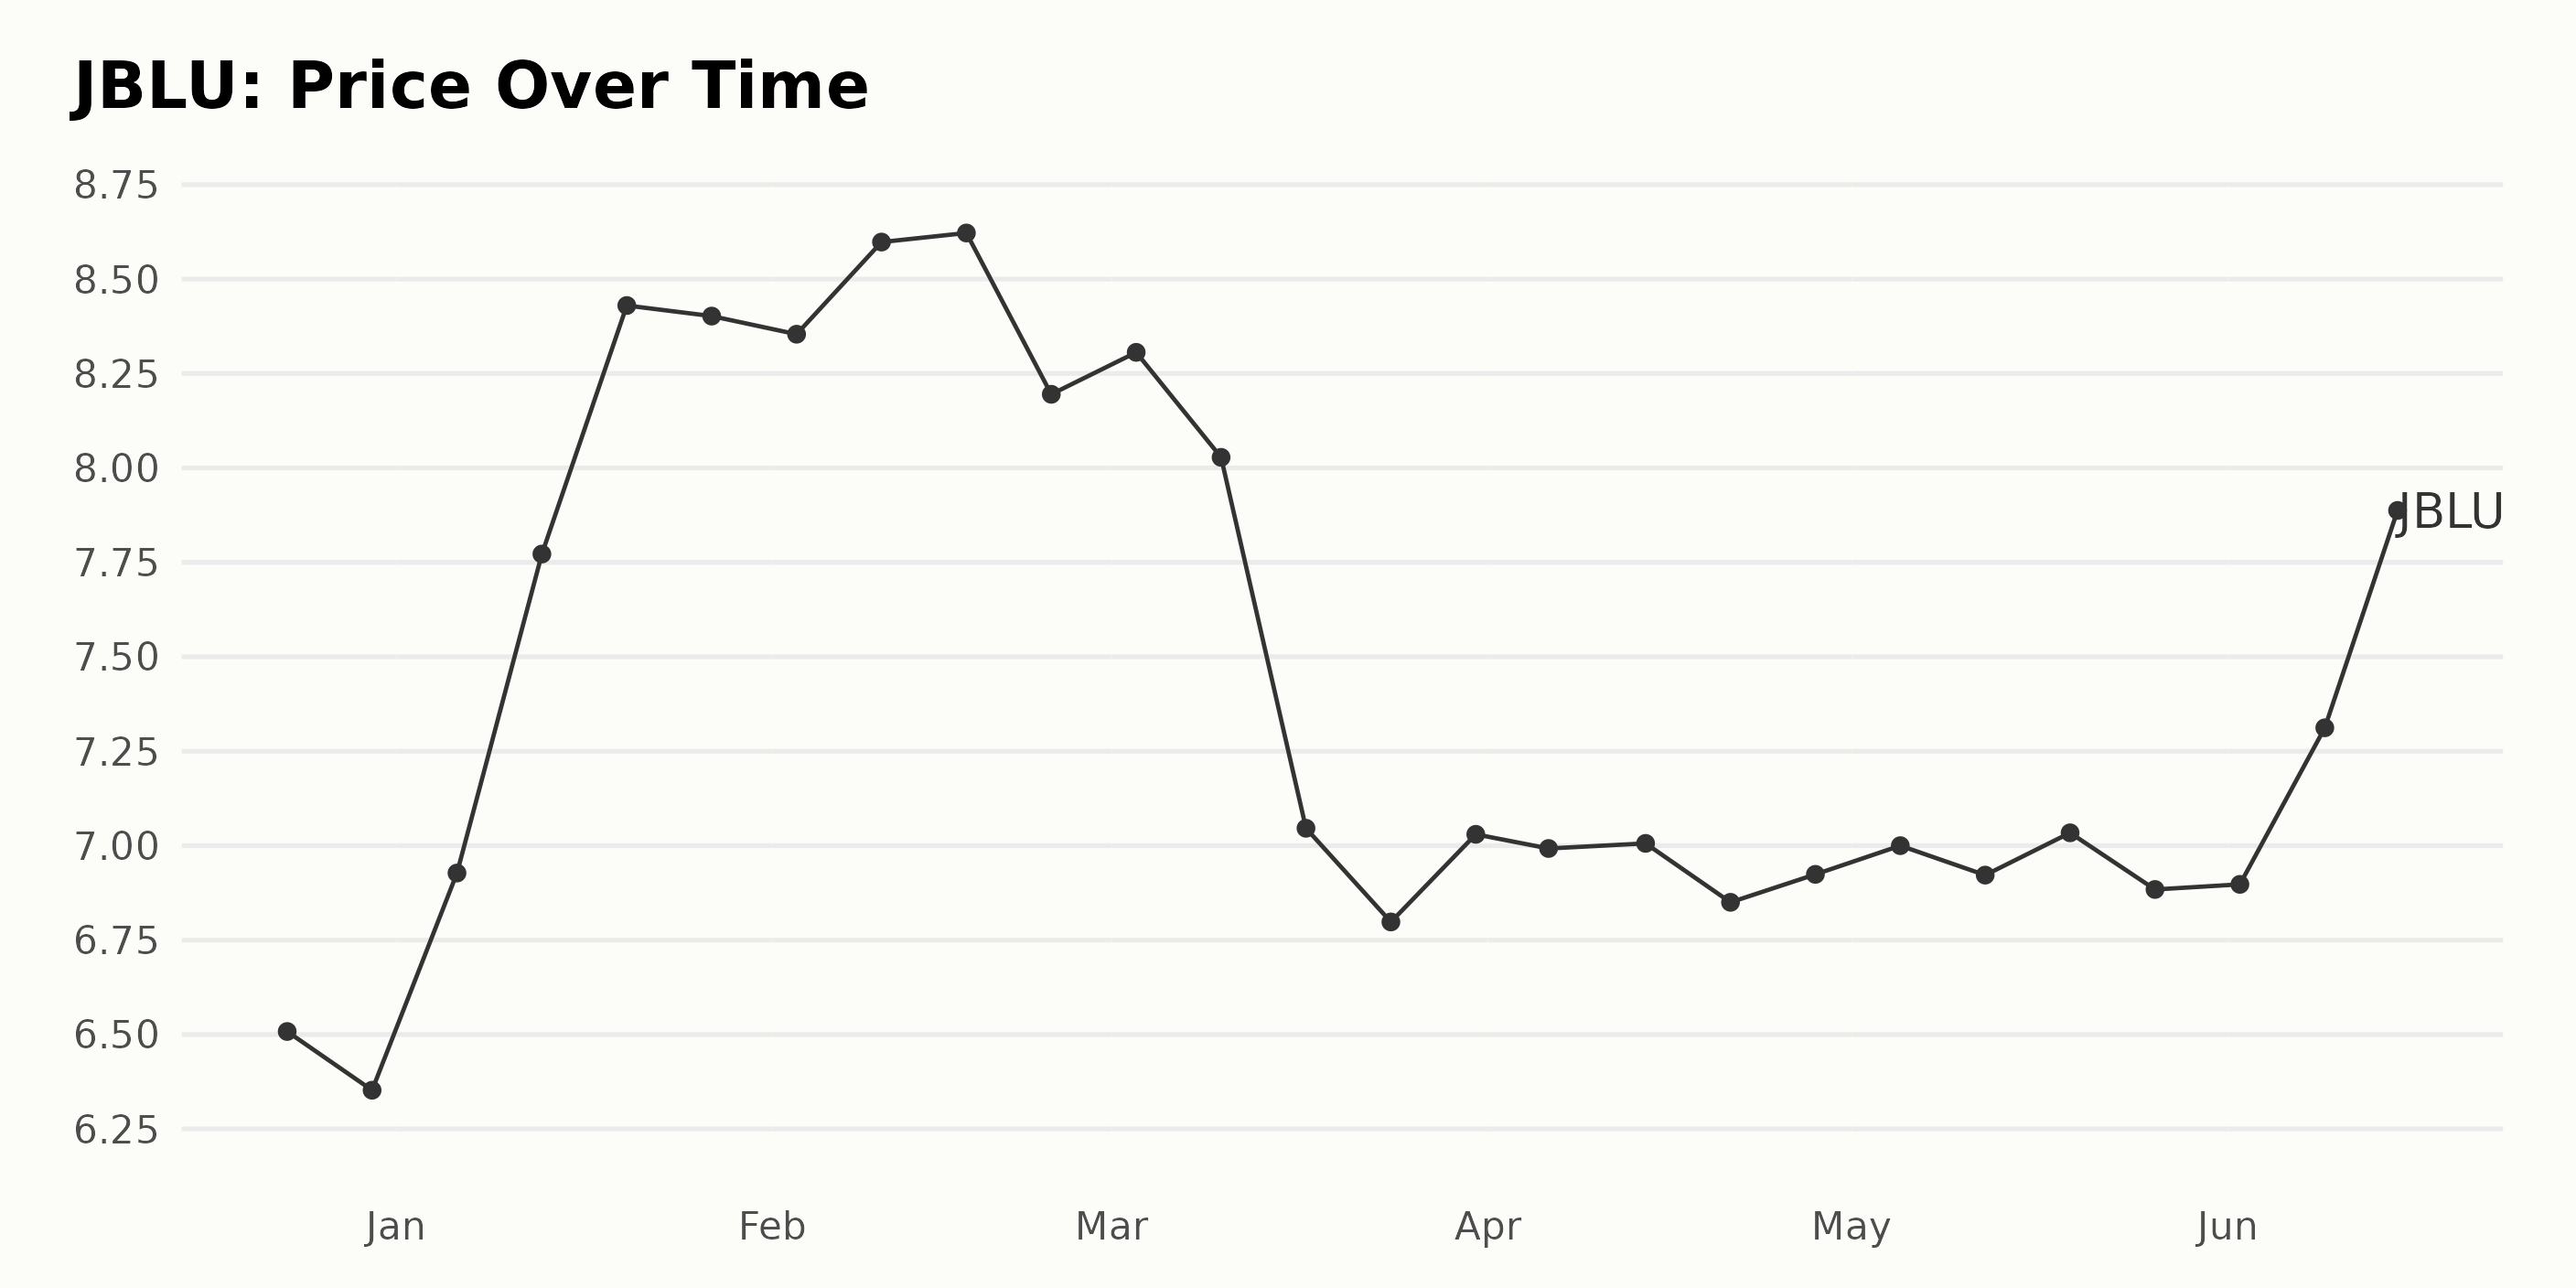
JBLU’s share prices show an overall upward trend with some fluctuations in the provided data. Here is a summary of the trend: December 23, 2022: $6.51. December 30, 2022: $6.35.
From December 2022 to January 2023, the prices witnessed a significant increase: January 6, 2023: $6.93. January 13, 2023: $7.77. January 20, 2023: $8.43. January 27, 2023: $8.40.
Throughout February 2023, the prices experienced small ups and downs but remained relatively stable: February 3, 2023: $8.35. February 10, 2023: $8.60. February 17, 2023: $8.62. February 24, 2023: $8.20.
JBLU's share prices decreased in early March 2023 and continued to fluctuate between $6.80 and $8.30 during the next two months. March 3, 2023: $8.31. March 10, 2023: $8.03. March 17, 2023: $7.05. March 24, 2023: $6.80. March 31, 2023: $7.03. April 6, 2023: $6.99. April 14, 2023: $7.01. April 21, 2023: $6.85. April 28, 2023: $6.92.
The prices showed a slight increase in May 2023 but remained below the peak value from January: May 5, 2023: $7.00. May 12, 2023: $6.92. May 19, 2023: $7.03. May 26, 2023: $6.88.
In early June 2023, the prices started to rise again: June 2, 2023: $6.90. June 9, 2023: $7.31. June 15, 2023: $8.00.
In summary, JBLU's share price trend experienced an overall increase, with a significant growth rate from December 2022 to January 2023. The prices remained relatively stable from February to May 2023, ending with a slight uptrend in June 2023. Here is a chart of JBLU's price over the past 180 days.
Exploring JetBlue's POWR Ratings: Growth, Momentum, and Value Take Center Stage
The overall POWR Ratings grade of JBLU, a stock in the Airlines industry, which consists of 28 stocks, has consistently been a C, which equates to Neutral, over the past several months. Its latest value, as of June 16, 2023, remains at C and has seen an improvement in its rank within the category. Here's an overview of its performance:
- December 24, 2022 - Grade: C, Rank in Category: #24
- January 28, 2023 - Grade: C, Rank in Category: #23
- February 4, 2023 - Grade: C, Rank in Category: #22
- February 25, 2023 - Grade: C, Rank in Category: #24
- March 11, 2023 - Grade: C, Rank in Category: #26
- March 18, 2023 - Grade: C, Rank in Category: #24
- April 29, 2023 - Grade: C, Rank in Category: #24
- May 13, 2023 - Grade: C, Rank in Category: #22
- June 3, 2023 - Grade: C, Rank in Category: #22
- June 10, 2023 - Grade: C, Rank in Category: #21
- June 16, 2023 - Grade: C, Rank in Category: #21
This data shows that JBLU has been gradually improving its ranking within the Airlines industry from December 2022 to June 2023.
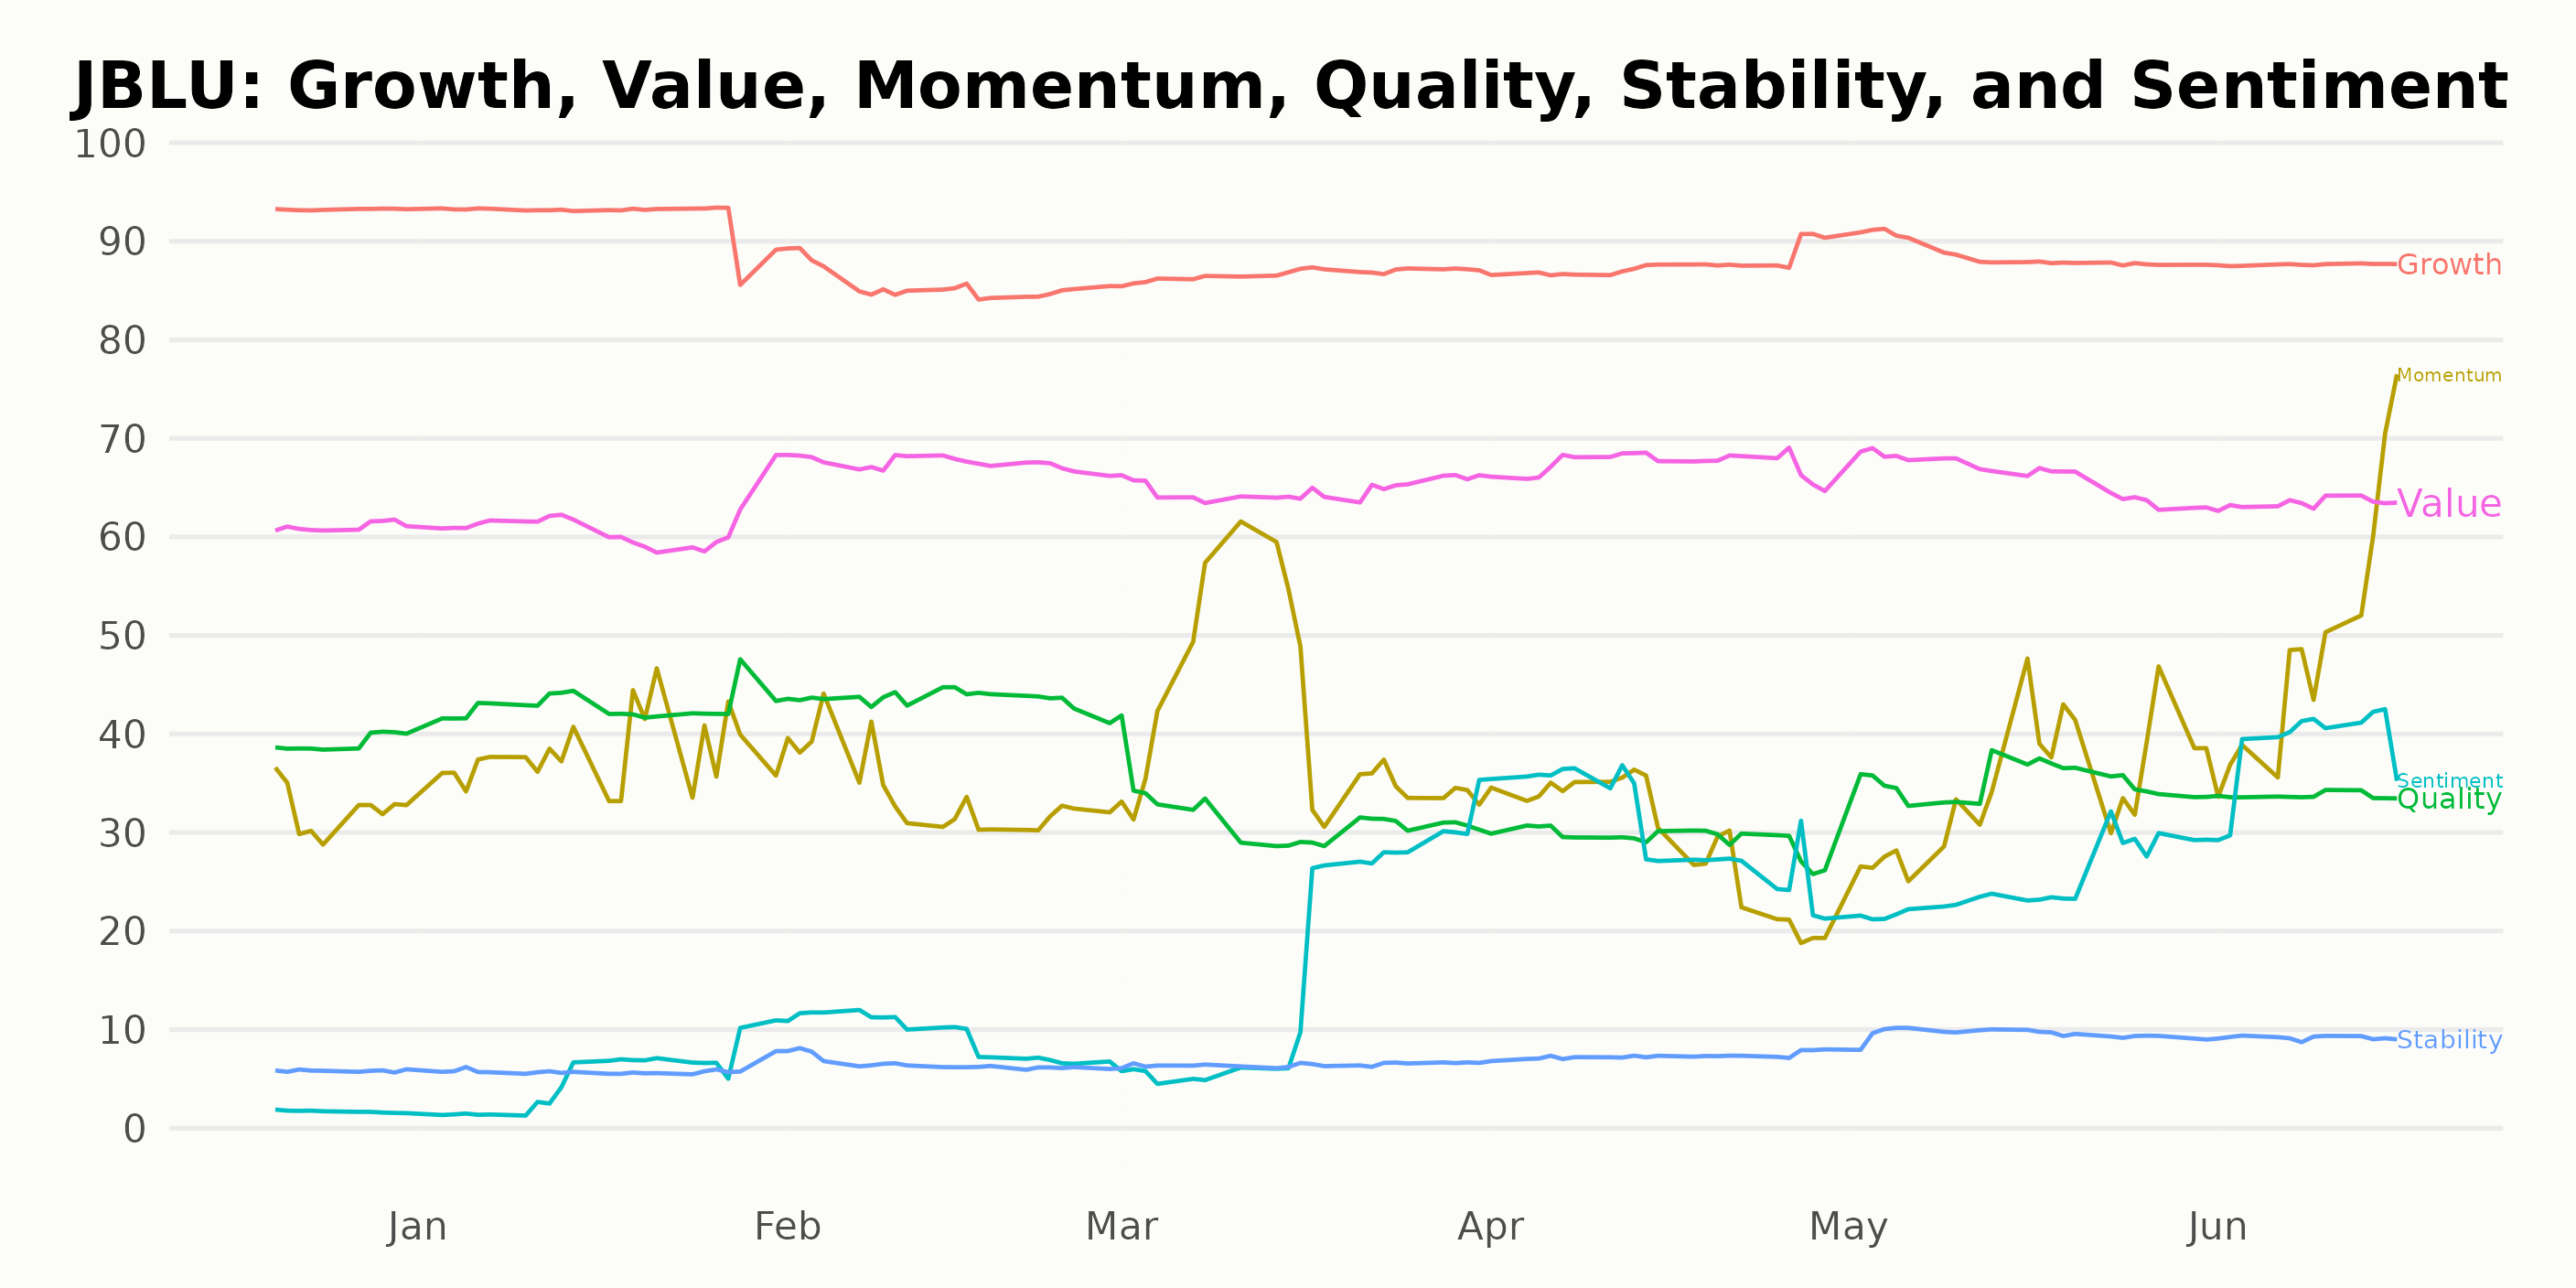
In analyzing the POWR Ratings for JBLU along six dimensions, the three most noteworthy dimensions include Growth, Momentum, and Value. Here are the significant points worth discussing:
- Growth: The Growth rating has remained consistently strong during the observed period, starting at 93 on December 31, 2022, and generally ranging from 86 to 89 after February 28, 2023.
- Momentum: The Momentum rating exhibits a clear upward trend, increasing from 32 on December 31, 2022, to 47 by June 15, 2023.
- Value: The Value rating experiences some fluctuation, but overall remains moderately stable, with the highest rating being 68 on February 28, 2023, and the lowest being 61 between December 31, 2022, and January 31, 2023. It settles around 63 to 67 between April 29, 2023, and June 15, 2023.
How does JetBlue Airways Corporation (JBLU) Stack Up Against its Peers?
Other stocks in the Airlines sector that may be worth considering are Qantas Airways Limited (QABSY), Singapore Airlines Limited (SINGY), and Air France-KLM SA (AFLYY) - they have better POWR Ratings.
Is the Bear Market Over?
Investment pro Steve Reitmeister sees signs of the bear market’s return. That is why he has constructed a unique portfolio to not just survive that downturn...but even thrive!
Steve Reitmeister’s Trading Plan & Top Picks >
JBLU shares were trading at $8.09 per share on Friday afternoon, up $0.09 (+1.13%). Year-to-date, JBLU has gained 24.85%, versus a 15.94% rise in the benchmark S&P 500 index during the same period.
About the Author: Anushka Dutta

Anushka is an analyst whose interest in understanding the impact of broader economic changes on financial markets motivated her to pursue a career in investment research.
The post Is JetBlue Airways (JBLU) a Good Summer Stock to Watch? appeared first on StockNews.com