 This week was no worse than last week.
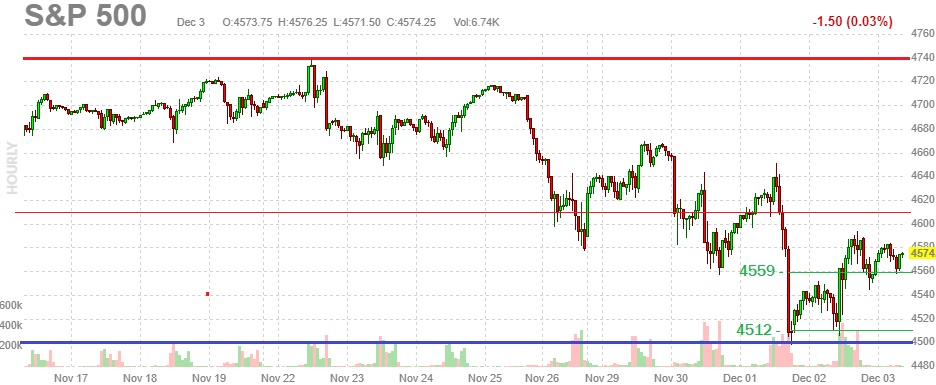
As you can see on the S&P 500 chart, we've fallen about the same amount and bounced about the same amount this week and last and if we slow-step our way to a correction – that can be nice and healthy for the markets. Notice we have support on the Strong Bounce Line at 4,559 on the S&P 500 and, if that holds today – it bodes well for next week. If the week bounce line at 4,512 fails, however, we'll be looking to add more hedges into the close.
 We went over the bounce lines for all our indexes yesterday but, to summarize, we have:
- Dow 36,000 to 34,200 has bounce lines of 34,560 (weak) and 34,920 (strong)
- S&P 4,700 to 4,465 has bounce lines of 4,512 (weak) and 4,559 (strong)
- Nasdaq 16,500 to 15,675 has bounce lines of 15,840 (weak) and 16,005 (strong)
- Russell 2,400 to 2,080 has bounce lines of 2,144 (weak) and 2,208 (strong)
 These bounce charts are useful because the let us know when we nee more hedges (when they go all red) and when we're out of danger (all green). At the moment, it's telling us to wait and see but things are not too bad with only one red box at the moment.
We're still watching the Russell as our canary in the coal mine as that index is undergoing the bigger correction (10% vs 2.5% for the others) and failing that (2,160) will almost certainly drag the others down with it. As you can see – we've barely held that line for the last two days so one day above it is no cause for a party.
We have picked up plenty of stocks while they were on sale. We added 4 of them to our Money Talk Portfolio when I was on that show on Wednesday evening, so we are bullish enough for the following quarter. As I said on the show, I'm bullish that the Government and the Fed have at least one more bailout left in them but I would certainly take that opportunity to cash out – because we're at a real tipping…