16%. That's the percentage of S&P 500 stocks that are trading at their 52-week highs while the index itself is at a record 4,700. That is historicially narrow participation, the kind that often precedes a correction. If you think about it, since ETFs rule these days – the S&P 500 rally SHOULD be the rising tide that lifts all ships but what's really happening is the Banksters, who along with their Top 0.1% clients own 80% of all equities, are manipulating the heavily-weighted stocks to prop up the indexes while they are dumping the bulk of their over-priced holdings – just like they do at the end of every rally. It's their job … In the Fed's 85-page Financial Stability Report published moments after the market close yesterday, the Fed warned that as Bloomberg put it, " prices of risky assets keep rising, making them more susceptible to perilous crashes if the economy takes a turn for the worse " adding that “ asset prices remain vulnerable to significant declines should investor risk sentiment deteriorate, progress on containing the virus disappoint, or the economic recovery stall ." You know, what I've been saying all summer but now it's from the Fed – so people might listen. As noted by Zero Hedge: The Fed's full view of the current level of vulnerabilities is as follows: Asset valuations . Prices of risky assets generally increased since the previous report, and, in some markets , prices are high compared with expected cash flows. House prices have increased rapidly since May, continuing to outstrip increases in rent. Nevertheless, despite rising housing valuations, little evidence exists of deteriorating credit standards or highly leveraged investment activity in the housing market. Asset prices remain vulnerable to significant declines should investor risk sentiment deteriorate, progress on containing the virus disappoint, or the economic recovery stall. Borrowing by businesses and households . Key measures of vulnerability from business debt, including debt-to-GDP, gross leverage, and interest coverage ratios, …
 16%.
16%.
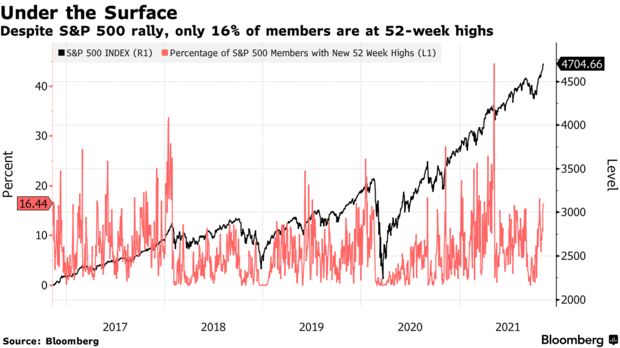
That's the percentage of S&P 500 stocks that are trading at their 52-week highs while the index itself is at a record 4,700. That is historicially narrow participation, the kind that often precedes a correction. If you think about it, since ETFs rule these days – the S&P 500 rally SHOULD be the rising tide that lifts all ships but what's really happening is the Banksters, who along with their Top 0.1% clients own 80% of all equities, are manipulating the heavily-weighted stocks to prop up the indexes while they are dumping the bulk of their over-priced holdings – just like they do at the end of every rally. It's their job…
In the Fed's 85-page Financial Stability Report published moments after the market close yesterday, the Fed warned that as Bloomberg put it, "prices of risky assets keep rising, making them more susceptible to perilous crashes if the economy takes a turn for the worse" adding that “asset prices remain vulnerable to significant declines should investor risk sentiment deteriorate, progress on containing the virus disappoint, or the economic recovery stall." You know, what I've been saying all summer but now it's from the Fed – so people might listen.
As noted by Zero Hedge:
The Fed's full view of the current level of vulnerabilities is as follows:
- Asset valuations. Prices of risky assets generally increased since the previous report, and, in some markets, prices are high compared with expected cash flows. House prices have increased rapidly since May, continuing to outstrip increases in rent. Nevertheless, despite rising housing valuations, little evidence exists of deteriorating credit standards or highly leveraged investment activity in the housing market. Asset prices remain vulnerable to significant declines should investor risk sentiment deteriorate, progress on containing the virus disappoint, or the economic recovery stall.
- Borrowing by businesses and households. Key measures of vulnerability from business debt, including debt-to-GDP, gross leverage, and interest coverage ratios,
…

 16%.
16%.