 ( click to enlarge )
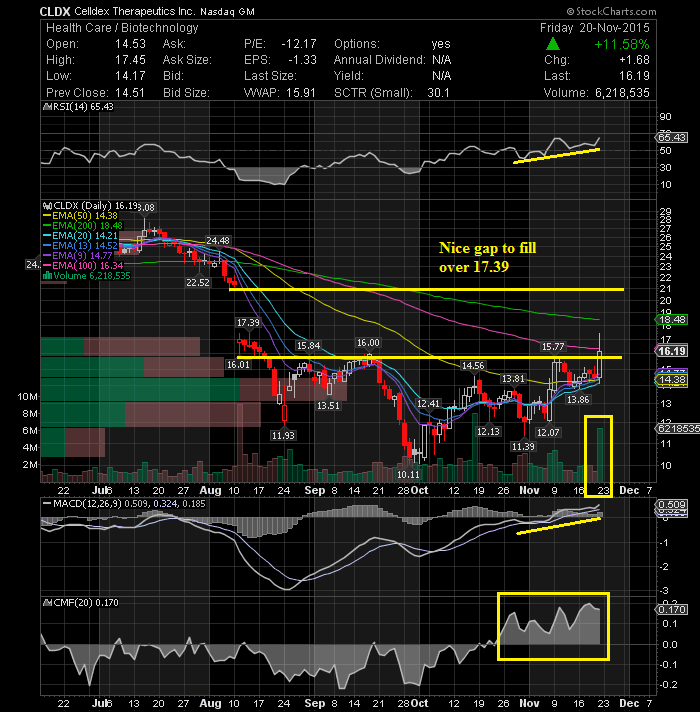
Celldex Therapeutics, Inc. (NASDAQ:CLDX) which has been building momentum since late-October, broke out of its bullish consolidation on massive volume on news that its Rintega brain cancer vaccine reduced the risk of death from the disease by 47 percent in a 73 patient randomized study. Plus, the survival rate at 2 years was 25% for patients given the vaccine versus none in the control group, so I was motivated to buy more shares. This move broke the stock out of a triple top resistance zone that contained the upmove since August. From a technical standpoint daily technical indicators are looking bullish. The MACD is above its signal line and is moving up in positive territory. CMF is also positive and RSI has moved above its 60% level. On longer-term daily chart, the stock is trading below its 100-day and 200-day EMAs but well above its rising 50-day EMA. The short-term bull market is intact, despite being in a bear market in the medium-term. I think the stock next week can easily re-visit its 200-day EMA at $18.48, if not higher. Based on Friday's news, I expect upgrades coming soon.
 ( click to enlarge )
Bellerophon Therapeutics Inc (NASDAQ:BLPH) Calling a bottom is always extremely difficult, but in my opinion this daily technical chart is showing some positive momentum divergences. Honestly, the selling pressure seems to be losing momentum and Friday we saw unusual volume. If the stock can hold the support around 2.85 we may see a bounce to $4 or more very soon. Note: The fact that the company is now trading below cash levels ($4.02 in cash), provides further protection. I bought this stock on Friday...Keep in mind, Bio-mania is back and I am always eager to find these kind of setups (Solid bottoms with positive divergences) and act on them in these times of euphoria.
 ( click to enlarge )
Nice runner from Thursday's Twitter buy list. Ambarella Inc (NASDAQ:AMBA) traded nicely on Friday and I’m looking for continuation of the upward direction next week. The stock is a short squeeze candidate, with a short float at 43% equivalent to 6 days of average volume. From a technical standpoint, the daily technical chart shows that the stock is in a rally as %K line is rising on top of %D line as the price is back above the short-term EMAs and with a positive MACD action. The RSI is also rising along with the rise in volumes indicates buying interest in the stock. At the same time, price broke out of downtrend line which goes back to the September top. Can get interesting. Keep close eye on this one for a major rally to the upside.
 ( click to enlarge )
It is very clear that the stock wants to move higher again, but too much caution right now. Rambus Inc. (NASDAQ:RMBS) needs to take out $11.34. The break of the resistance line with heavy volume should be the next buy point. The short-term trend is still bullish as the stock is still on top of 9,13 and 20EMAs. Other good news, the RSI is perking up and the MACD is moving up. I think the stock has room to go higher. Watch the stock closely next week.
 ( click to enlarge )
BlackBerry Ltd (NASDAQ:BBRY) For the first time in weeks, the 50-day moving average is starting to rise, suggesting that the medium-term trend has switched to bullish. The daily technical indicators remain Bullish. The MACD is positive and above its signal line. The RSI is bullish as it rises above its 50% level and the slow stochastic is climbing towards its neutral zone. Plus, all three short-term EMAs have started moving up. Friday’s intraday high of 7.90 is the highest level the stock has touched in more than a week. A break above 8.25 (200EMA) will push the STOCK into a BULL market.
 ( click to enlarge )
JD (NASDAQ:JD) looks to be setting up for an upside move. The price is in the top of a short-term trading range. Resistance is $30.26. At this stage it is definitely a wait and see if this key resistance will be easily taken out by the bulls. Stay tuned.
 ( click to enlarge )
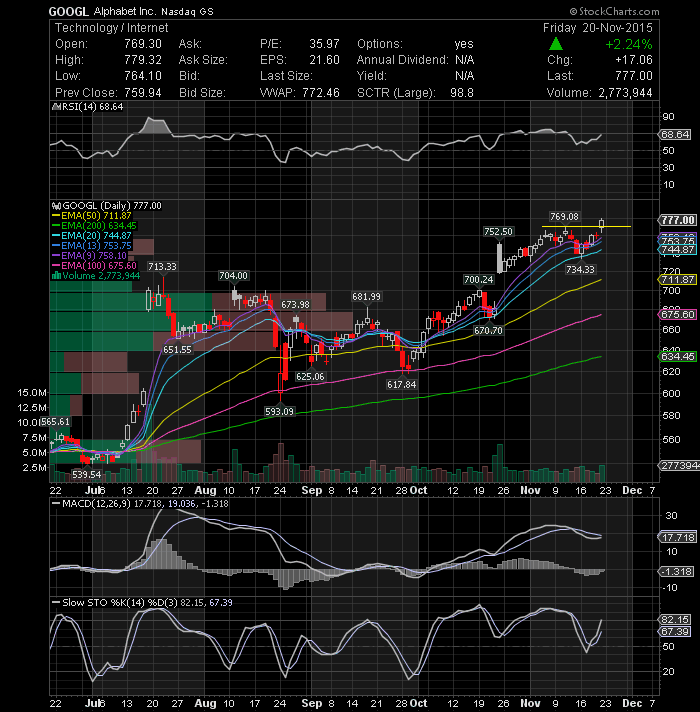
Alphabet Inc (NASDAQ:GOOGL) has a bullish looking chart. Price broke out to a new all-time high Friday, accompanied by a good volume suggesting higher levels.The stock has been in a nice uptrend for the last two months and it looks very strong with both 50-day and 200-day exp moving averages going up while %K line is on top of %D line. Long setup.
 ( click to enlarge )
Straight Path Communications Inc (NYSEMKT:STRP) The daily technical indicators of the stock are gaining some momentum and are close to flashing some buy signals. The trend is down, but this is a good spot to speculate a potential strong oversold bounce.
I would like to remind everybody that Benzinga Pro's news feed is my streaming plataform and could be your best Xmas gift. It's a streaming platform with all the information you need to invest better today.It delivers real-time financial news straight to your desktop. I recommend this tool to all my readers/friends due to its functionality/speed and reliability. START NOW FOR JUST $1
Disclaimer : This is not an investment advisory, and should not be used to make investment decisions. Information in AC Investor Blog is often opinionated and should be considered for information purposes only. No stock exchange anywhere has approved or disapproved of the information contained herein. There is no express or implied solicitation to buy or sell securities. The charts provided here are not meant for investment purposes and only serve as technical examples. Don't consider buying or selling any stock without conducting your own due diligence.
Thanks for visiting AC Investor Blog.
AC
