
Medical technology company Teleflex (NYSE: TFX) missed Wall Street’s revenue expectations in Q4 CY2025, with sales falling 28.5% year on year to $569 million. Its non-GAAP profit of $1.93 per share was 48.4% below analysts’ consensus estimates.
Is now the time to buy Teleflex? Find out by accessing our full research report, it’s free.
Teleflex (TFX) Q4 CY2025 Highlights:
- Revenue: $569 million vs analyst estimates of $921.9 million (28.5% year-on-year decline, 38.3% miss)
- Adjusted EPS: $1.93 vs analyst expectations of $3.74 (48.4% miss)
- Adjusted EPS guidance for the upcoming financial year 2026 is $6.40 at the midpoint, missing analyst estimates by 58%
- Operating Margin: 2.4%, up from -13.9% in the same quarter last year
- Free Cash Flow was -$92.94 million, down from $170.6 million in the same quarter last year
- Constant Currency Revenue rose 4.3% year on year (3.2% in the same quarter last year)
- Market Capitalization: $4.94 billion
"Teleflex is in the midst of a transformation that optimizes our portfolio, creates a more focused medical technologies leader and positions our company for meaningful value creation opportunities going forward," said Stuart Randle, Teleflex's Interim President and Chief Executive Officer.
Company Overview
With a portfolio spanning from vascular access catheters to minimally invasive surgical tools, Teleflex (NYSE: TFX) designs, manufactures, and supplies single-use medical devices used in critical care and surgical procedures across hospitals worldwide.
Revenue Growth
Reviewing a company’s long-term sales performance reveals insights into its quality. Any business can put up a good quarter or two, but many enduring ones grow for years. Regrettably, Teleflex’s sales grew at a tepid 3% compounded annual growth rate over the last five years. This fell short of our benchmark for the healthcare sector and is a tough starting point for our analysis.
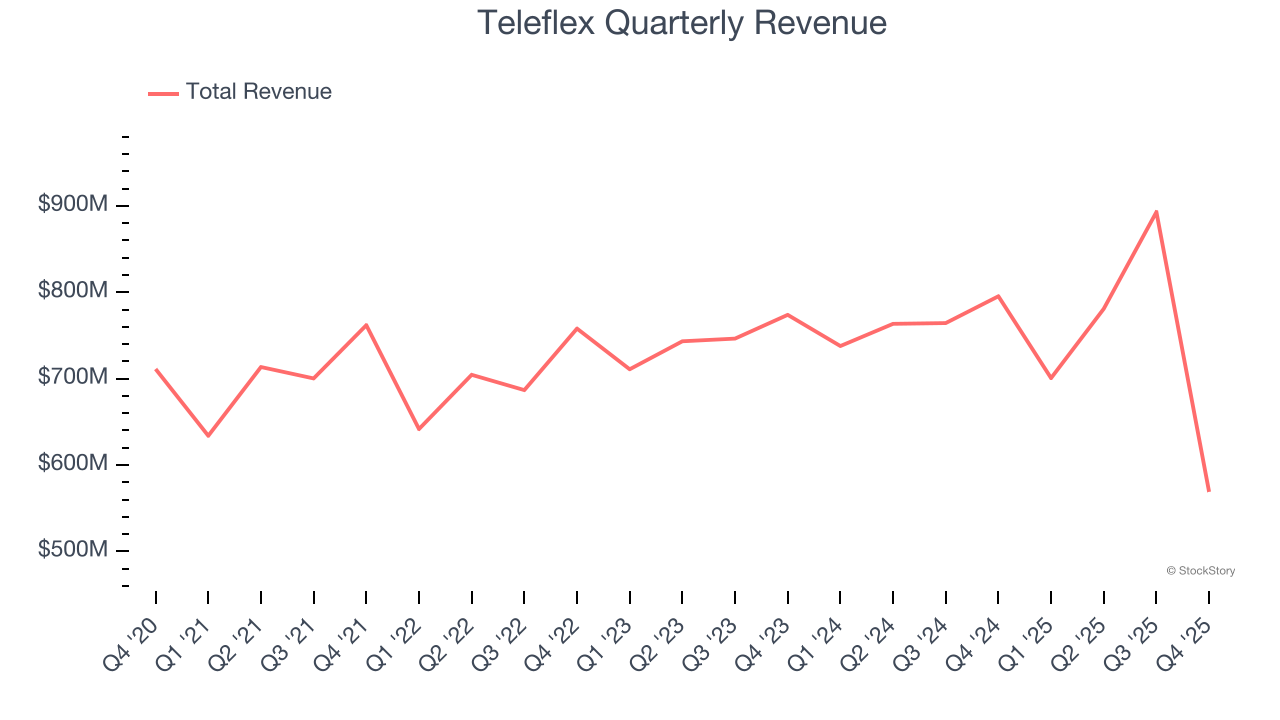
Long-term growth is the most important, but within healthcare, a half-decade historical view may miss new innovations or demand cycles. Teleflex’s recent performance shows its demand has slowed as its revenue was flat over the last two years. 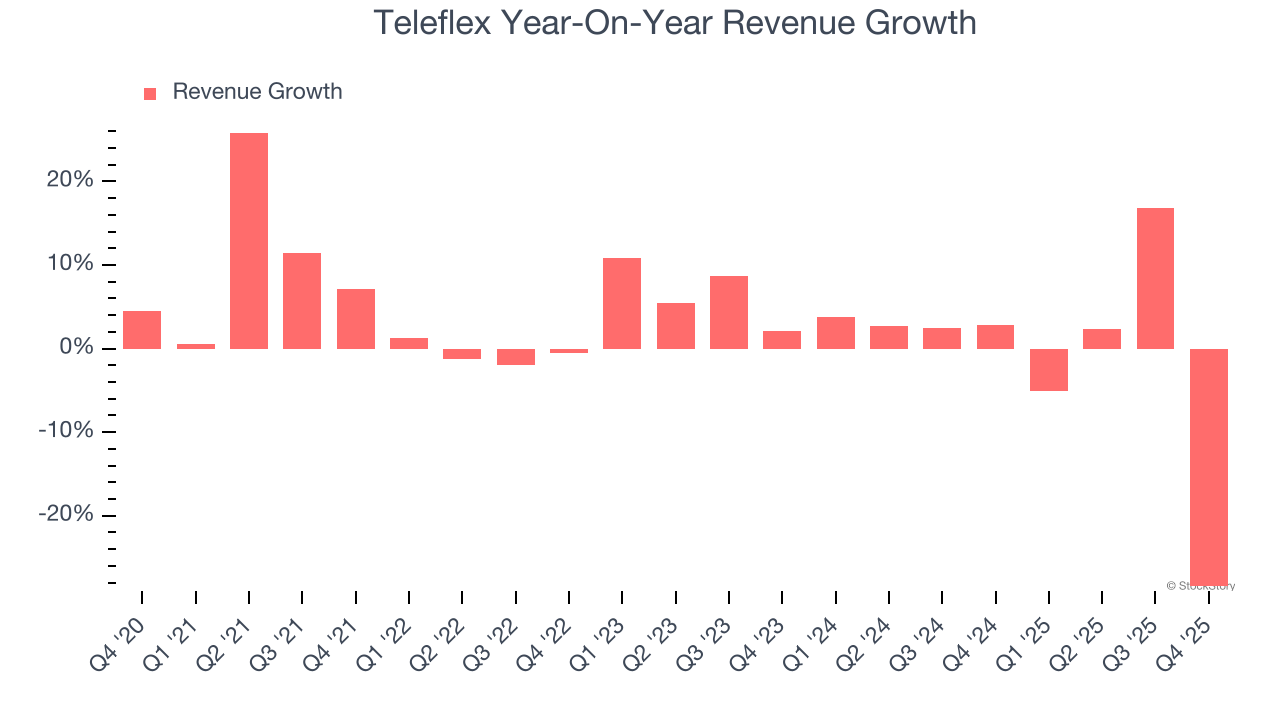
We can dig further into the company’s sales dynamics by analyzing its constant currency revenue, which excludes currency movements that are outside their control and not indicative of demand. Over the last two years, its constant currency sales averaged 3.7% year-on-year growth. Because this number is better than its normal revenue growth, we can see that foreign exchange rates have been a headwind for Teleflex. 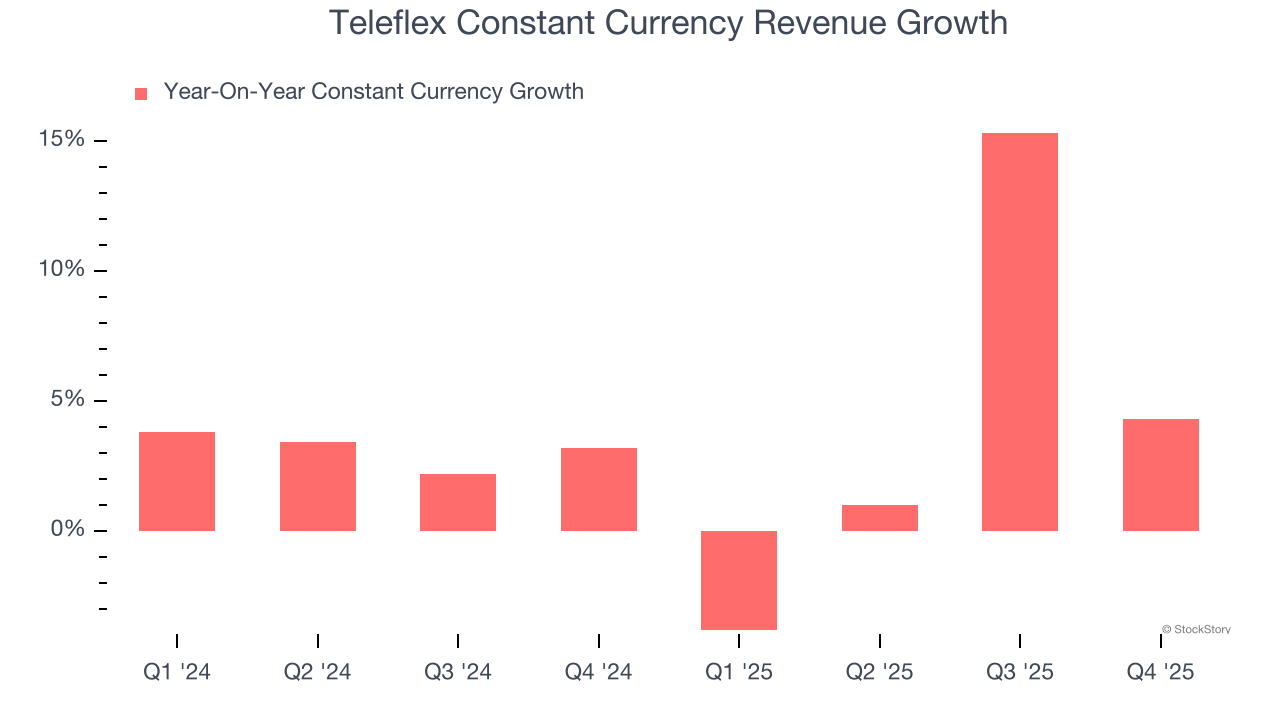
This quarter, Teleflex missed Wall Street’s estimates and reported a rather uninspiring 28.5% year-on-year revenue decline, generating $569 million of revenue.
Looking ahead, sell-side analysts expect revenue to grow 14.1% over the next 12 months, an improvement versus the last two years. This projection is noteworthy and indicates its newer products and services will catalyze better top-line performance.
The 1999 book Gorilla Game predicted Microsoft and Apple would dominate tech before it happened. Its thesis? Identify the platform winners early. Today, enterprise software companies embedding generative AI are becoming the new gorillas. a profitable, fast-growing enterprise software stock that is already riding the automation wave and looking to catch the generative AI next.
Operating Margin
Operating margin is one of the best measures of profitability because it tells us how much money a company takes home after subtracting all core expenses, like marketing and R&D.
Teleflex has done a decent job managing its cost base over the last five years. The company has produced an average operating margin of 11.5%, higher than the broader healthcare sector.
Analyzing the trend in its profitability, Teleflex’s operating margin decreased by 26.2 percentage points over the last five years. The company’s two-year trajectory also shows it failed to get its profitability back to the peak as its margin fell by 20.9 percentage points. This performance was poor no matter how you look at it - it shows its expenses were rising and it couldn’t pass those costs onto its customers.
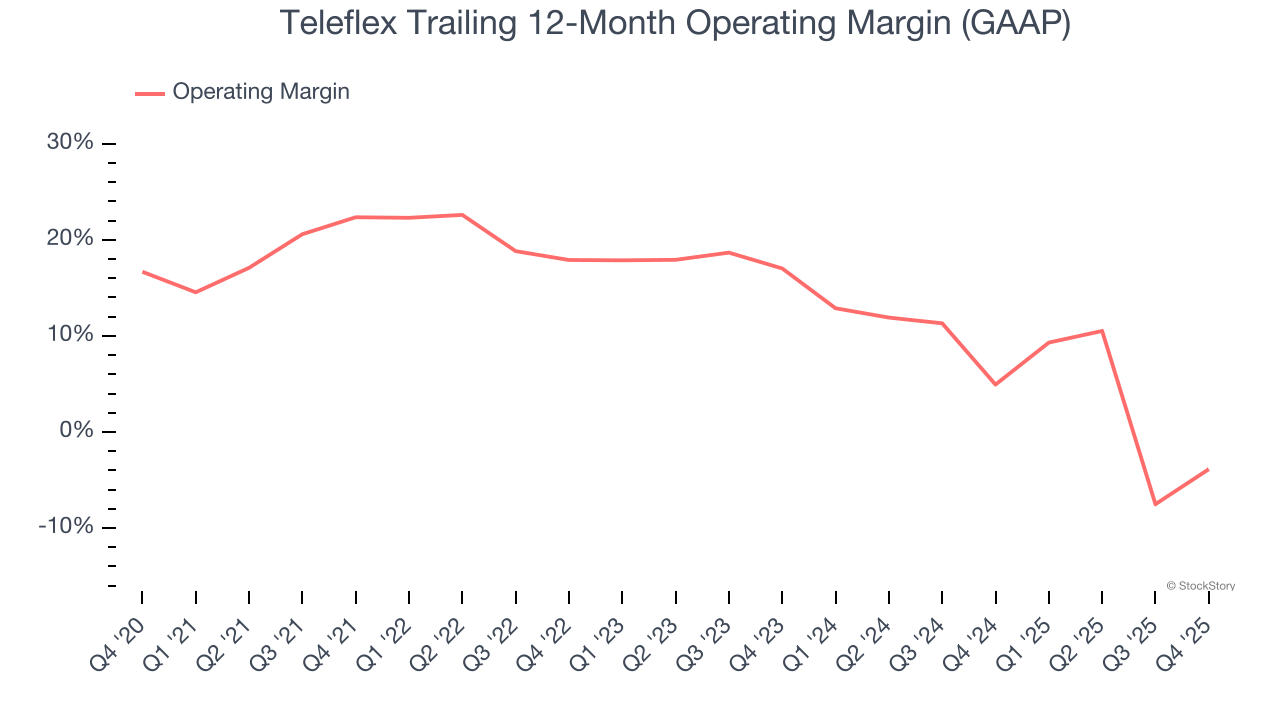
This quarter, Teleflex generated an operating margin profit margin of 2.4%, up 16.3 percentage points year on year. This increase was a welcome development, especially since its revenue fell, showing it was more efficient because it scaled down its expenses.
Earnings Per Share
We track the long-term change in earnings per share (EPS) for the same reason as long-term revenue growth. Compared to revenue, however, EPS highlights whether a company’s growth is profitable.
Teleflex’s unimpressive 2.8% annual EPS growth over the last five years aligns with its revenue performance. This tells us it maintained its per-share profitability as it expanded.
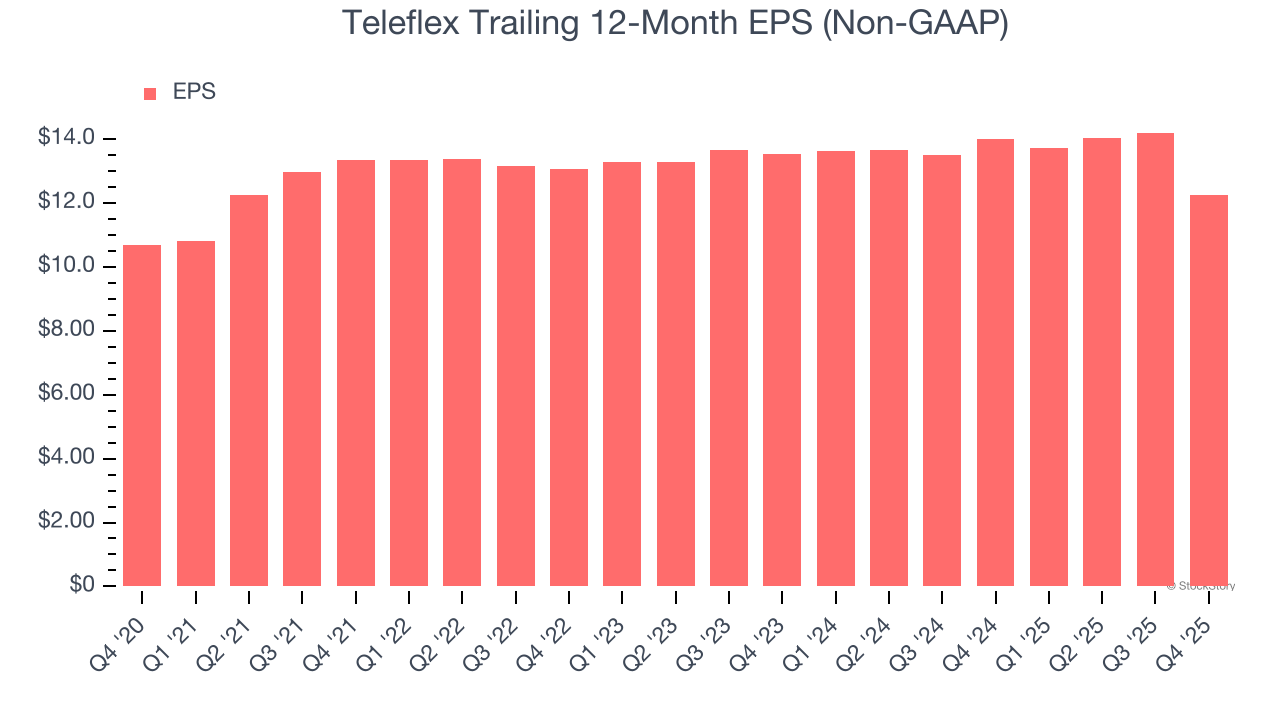
In Q4, Teleflex reported adjusted EPS of $1.93, down from $3.89 in the same quarter last year. This print missed analysts’ estimates. Over the next 12 months, Wall Street expects Teleflex’s full-year EPS of $12.24 to grow 23.9%.
Key Takeaways from Teleflex’s Q4 Results
We struggled to find many positives in these results. Its full-year EPS guidance missed and its revenue fell short of Wall Street’s estimates. Overall, this was a weaker quarter. The stock traded down 7% to $104.09 immediately after reporting.
Teleflex’s latest earnings report disappointed. One quarter doesn’t define a company’s quality, so let’s explore whether the stock is a buy at the current price. We think that the latest quarter is only one piece of the longer-term business quality puzzle. Quality, when combined with valuation, can help determine if the stock is a buy. We cover that in our actionable full research report which you can read here (it’s free).