
Economic consulting firm CRA International (NASDAQ: CRAI) reported Q4 CY2025 results exceeding the market’s revenue expectations, with sales up 11.6% year on year to $197 million. The company’s full-year revenue guidance of $795 million at the midpoint came in 2.9% above analysts’ estimates. Its non-GAAP profit of $2.06 per share was in line with analysts’ consensus estimates.
Is now the time to buy CRA? Find out by accessing our full research report, it’s free.
CRA (CRAI) Q4 CY2025 Highlights:
- Revenue: $197 million vs analyst estimates of $190.5 million (11.6% year-on-year growth, 3.4% beat)
- Adjusted EPS: $2.06 vs analyst estimates of $2.07 (in line)
- Adjusted EBITDA: $24.35 million vs analyst estimates of $23.41 million (12.4% margin, 4% beat)
- Operating Margin: 10.5%, down from 12.1% in the same quarter last year
- Free Cash Flow Margin: 29.9%, down from 39% in the same quarter last year
- Market Capitalization: $1.05 billion
“For the eighth consecutive year, CRA established a new record for annual revenue,” said Paul Maleh, CRA’s President and Chief Executive Officer.
Company Overview
Often retained for high-stakes matters with multibillion-dollar implications, CRA International (NASDAQ: CRAI) provides economic, financial, and management consulting services to corporations, law firms, and government agencies for litigation, regulatory proceedings, and business strategy.
Revenue Growth
A company’s long-term sales performance can indicate its overall quality. Any business can put up a good quarter or two, but the best consistently grow over the long haul.
With $751.6 million in revenue over the past 12 months, CRA is a small player in the business services space, which sometimes brings disadvantages compared to larger competitors benefiting from economies of scale and numerous distribution channels. On the bright side, it can grow faster because it has more room to expand.
As you can see below, CRA’s 8.1% annualized revenue growth over the last five years was solid. This is an encouraging starting point for our analysis because it shows CRA’s demand was higher than many business services companies.
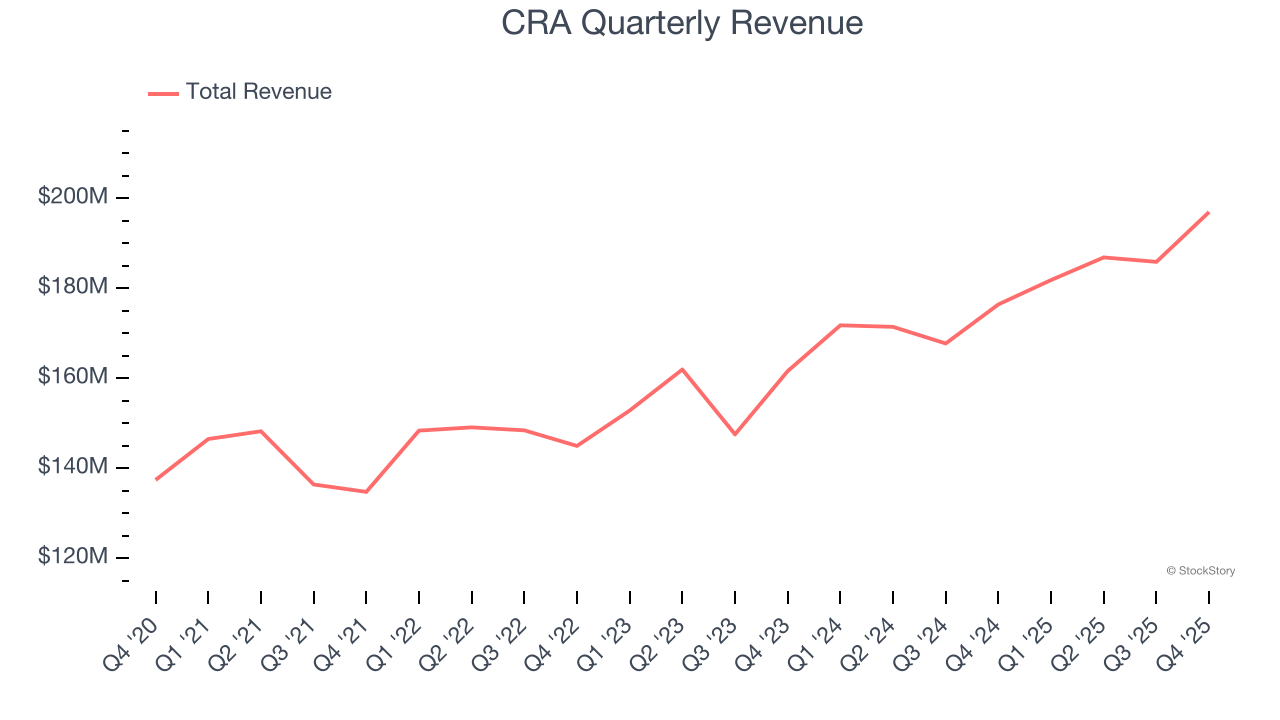
Long-term growth is the most important, but within business services, a half-decade historical view may miss new innovations or demand cycles. CRA’s annualized revenue growth of 9.8% over the last two years is above its five-year trend, suggesting its demand was strong and recently accelerated. 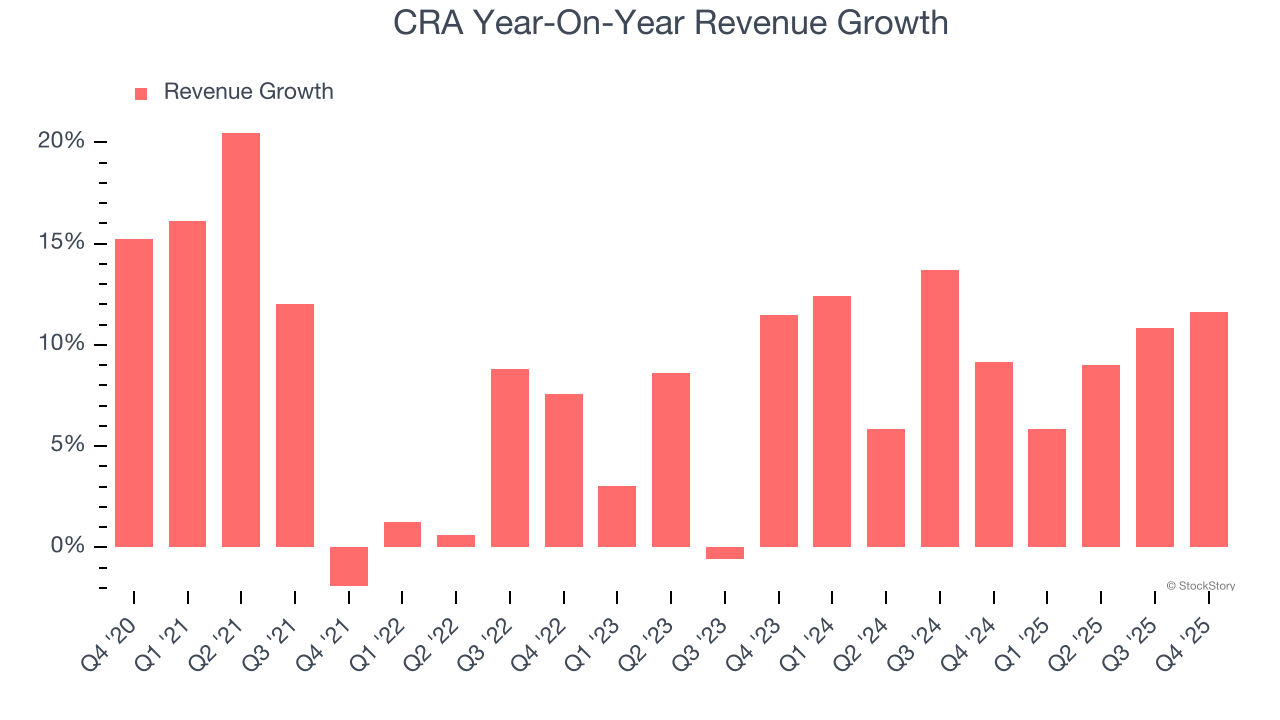
This quarter, CRA reported year-on-year revenue growth of 11.6%, and its $197 million of revenue exceeded Wall Street’s estimates by 3.4%.
Looking ahead, sell-side analysts expect revenue to remain flat over the next 12 months, a deceleration versus the last two years. This projection is underwhelming and indicates its products and services will face some demand challenges. At least the company is tracking well in other measures of financial health.
The 1999 book Gorilla Game predicted Microsoft and Apple would dominate tech before it happened. Its thesis? Identify the platform winners early. Today, enterprise software companies embedding generative AI are becoming the new gorillas. a profitable, fast-growing enterprise software stock that is already riding the automation wave and looking to catch the generative AI next.
Operating Margin
CRA has done a decent job managing its cost base over the last five years. The company has produced an average operating margin of 10.1%, higher than the broader business services sector.
Analyzing the trend in its profitability, CRA’s operating margin rose by 1.2 percentage points over the last five years, as its sales growth gave it operating leverage.
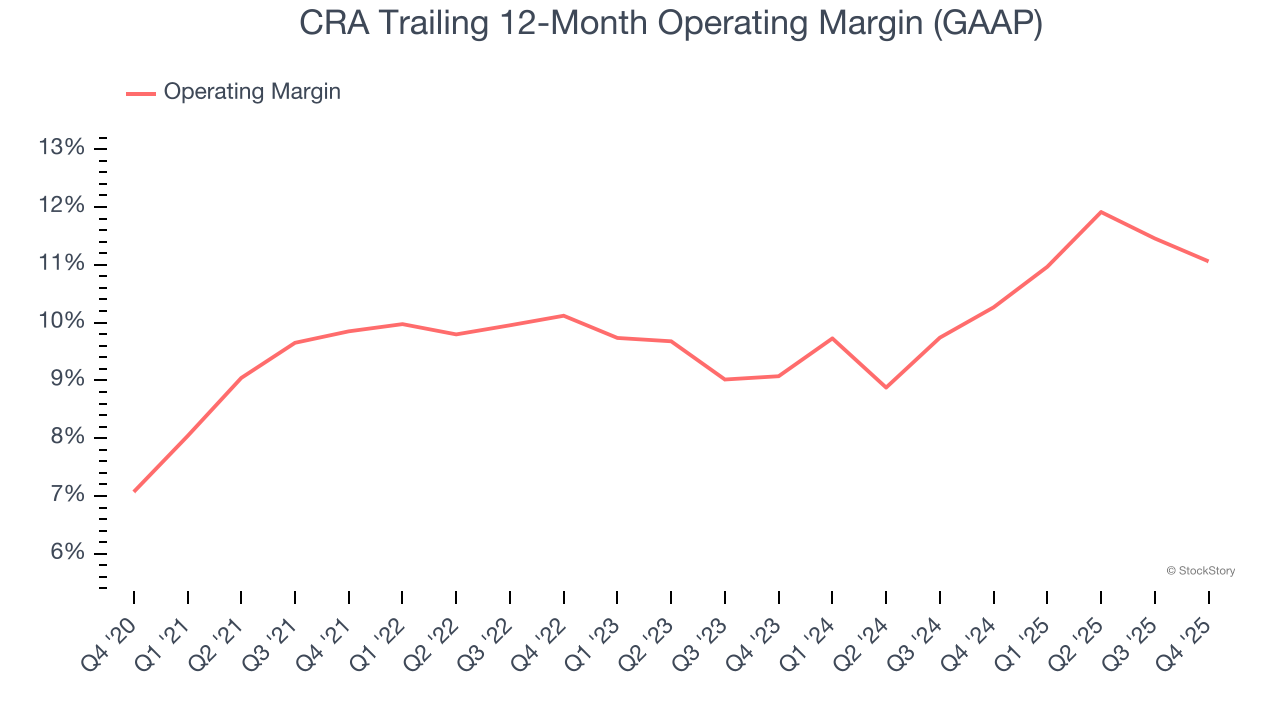
This quarter, CRA generated an operating margin profit margin of 10.5%, down 1.6 percentage points year on year. This reduction is quite minuscule and indicates the company’s overall cost structure has been relatively stable.
Earnings Per Share
We track the long-term change in earnings per share (EPS) for the same reason as long-term revenue growth. Compared to revenue, however, EPS highlights whether a company’s growth is profitable.
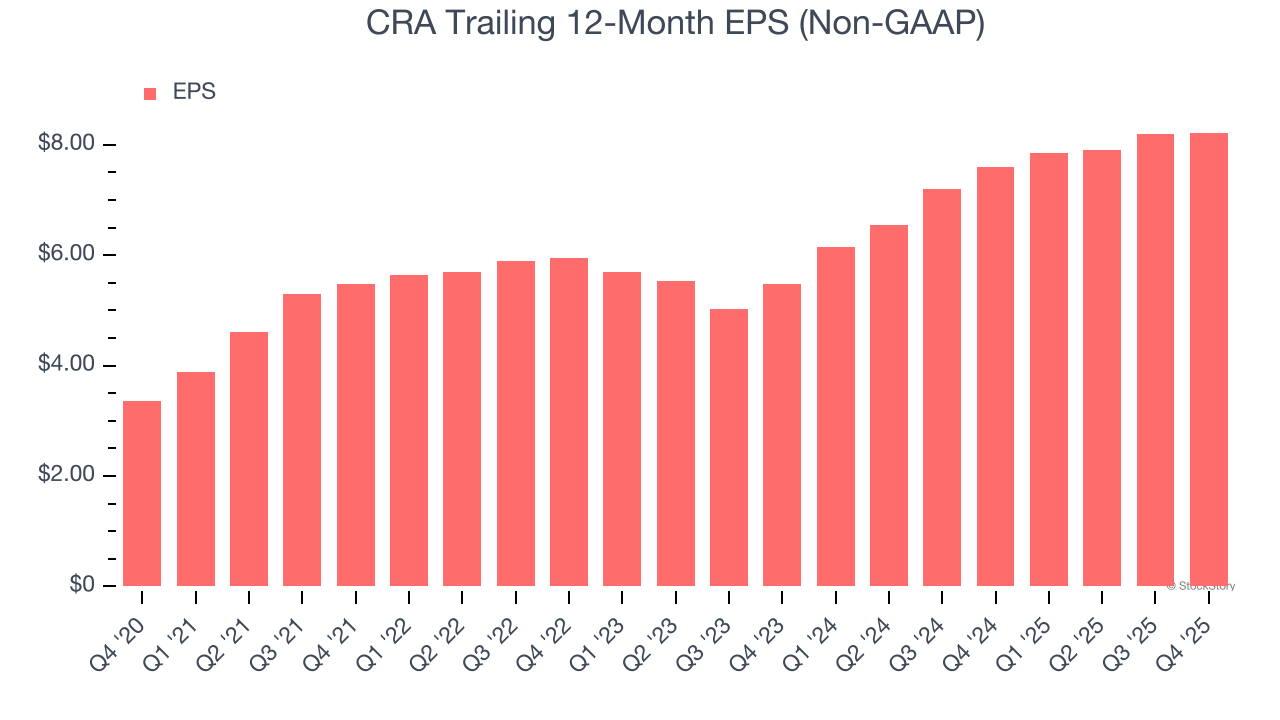
CRA’s EPS grew at an astounding 19.7% compounded annual growth rate over the last five years, higher than its 8.1% annualized revenue growth. This tells us the company became more profitable on a per-share basis as it expanded.
We can take a deeper look into CRA’s earnings quality to better understand the drivers of its performance. As we mentioned earlier, CRA’s operating margin declined this quarter but expanded by 1.2 percentage points over the last five years. Its share count also shrank by 16.2%, and these factors together are positive signs for shareholders because improving profitability and share buybacks turbocharge EPS growth relative to revenue growth. 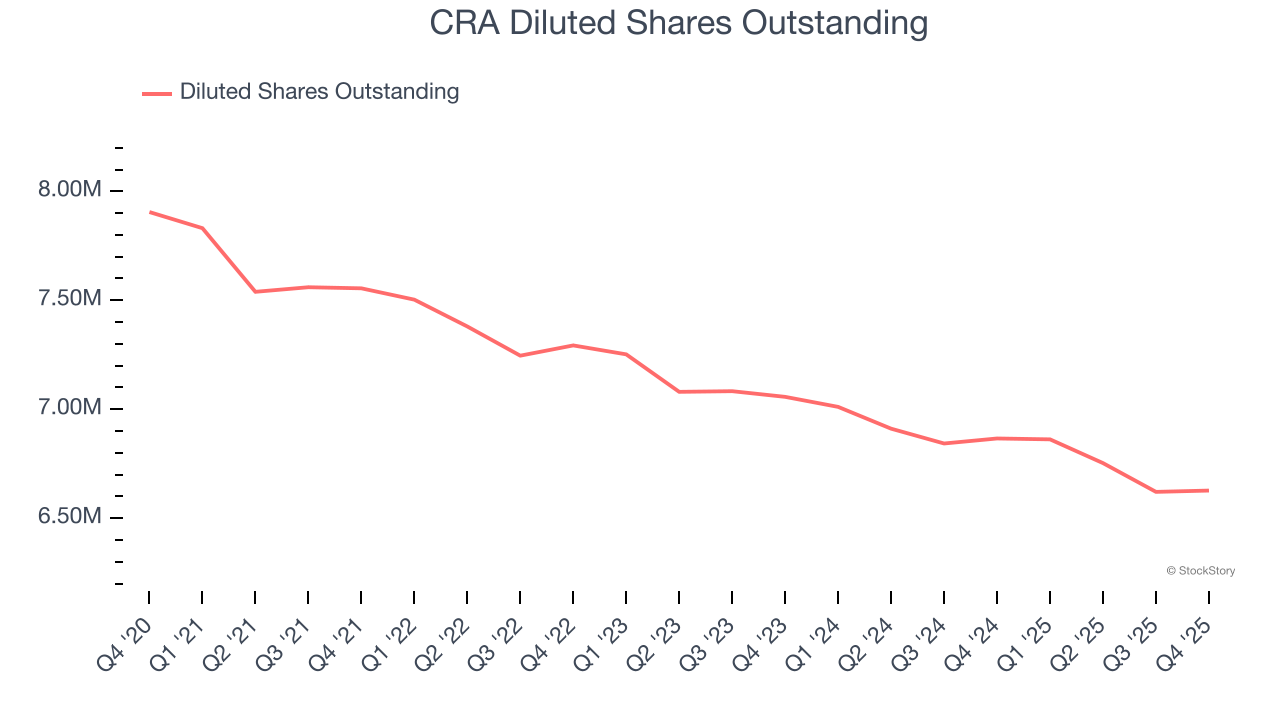
Like with revenue, we analyze EPS over a shorter period to see if we are missing a change in the business.
For CRA, its two-year annual EPS growth of 22.6% was higher than its five-year trend. We love it when earnings growth accelerates, especially when it accelerates off an already high base.
In Q4, CRA reported adjusted EPS of $2.06, up from $2.03 in the same quarter last year. This print was close to analysts’ estimates. Over the next 12 months, Wall Street expects CRA’s full-year EPS of $8.22 to grow 8.4%.
Key Takeaways from CRA’s Q4 Results
We enjoyed seeing CRA beat analysts’ revenue expectations this quarter. We were also glad its full-year revenue guidance exceeded Wall Street’s estimates. Overall, we think this was a decent quarter with some key metrics above expectations. The stock remained flat at $160.26 immediately following the results.
Is CRA an attractive investment opportunity at the current price? If you’re making that decision, you should consider the bigger picture of valuation, business qualities, as well as the latest earnings. We cover that in our actionable full research report which you can read here (it’s free).