Water management company Northwest Pipe (NASDAQ: NWPX) reported Q4 CY2025 results exceeding the market’s revenue expectations, with sales up 5% year on year to $125.6 million. Its non-GAAP profit of $0.93 per share was 50% above analysts’ consensus estimates.
Is now the time to buy Northwest Pipe? Find out by accessing our full research report, it’s free.
Northwest Pipe (NWPX) Q4 CY2025 Highlights:
- Revenue: $125.6 million vs analyst estimates of $122 million (5% year-on-year growth, 3% beat)
- Adjusted EPS: $0.93 vs analyst estimates of $0.62 (50% beat)
- Operating Margin: 10.4%, up from 8.8% in the same quarter last year
- Free Cash Flow Margin: 24.5%, down from 26.7% in the same quarter last year
- Market Capitalization: $702.9 million
"We delivered an exceptional fourth quarter with WTS revenue of $84.0 million and a healthy gross margin of 21.2%," said Scott Montross, President and Chief Executive Officer of NWPX Infrastructure.
Company Overview
Playing a large role in the Integrated Pipeline (IPL) project in Texas to deliver ~350 million gallons of water per day, Northwest Pipe (NASDAQ: NWPX) is a manufacturer of pipeline systems for water infrastructure.
Revenue Growth
A company’s long-term sales performance can indicate its overall quality. Any business can put up a good quarter or two, but the best consistently grow over the long haul. Luckily, Northwest Pipe’s sales grew at an excellent 13% compounded annual growth rate over the last five years. Its growth beat the average industrials company and shows its offerings resonate with customers, a helpful starting point for our analysis.
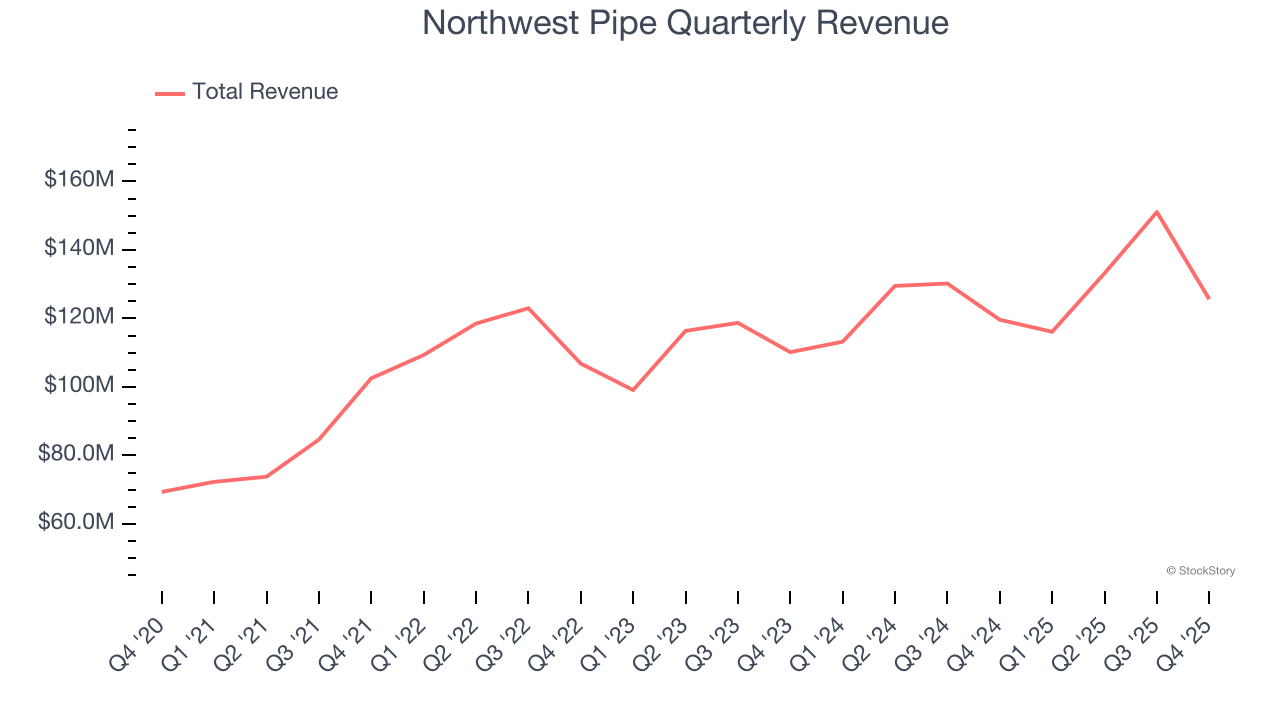
Long-term growth is the most important, but within industrials, a half-decade historical view may miss new industry trends or demand cycles. Northwest Pipe’s annualized revenue growth of 8.8% over the last two years is below its five-year trend, but we still think the results were respectable. 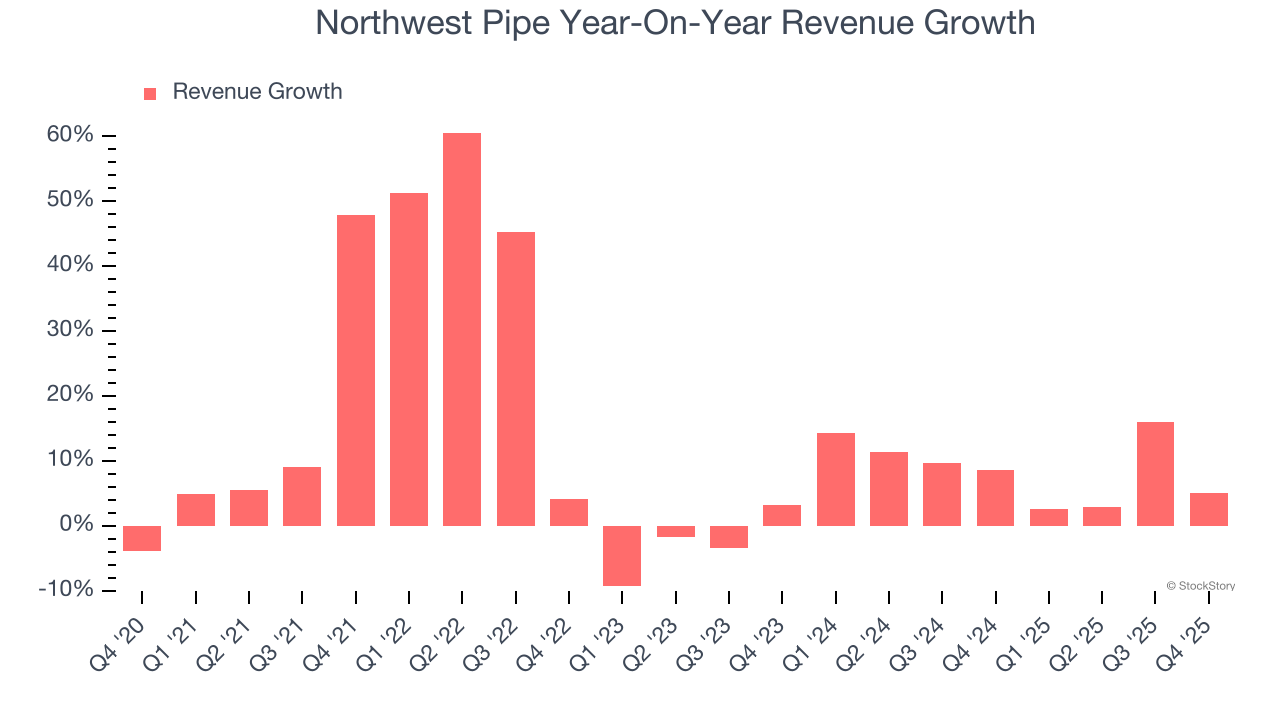
This quarter, Northwest Pipe reported year-on-year revenue growth of 5%, and its $125.6 million of revenue exceeded Wall Street’s estimates by 3%.
Looking ahead, sell-side analysts expect revenue to remain flat over the next 12 months, a deceleration versus the last two years. This projection doesn't excite us and indicates its products and services will face some demand challenges. At least the company is tracking well in other measures of financial health.
The 1999 book Gorilla Game predicted Microsoft and Apple would dominate tech before it happened. Its thesis? Identify the platform winners early. Today, enterprise software companies embedding generative AI are becoming the new gorillas. a profitable, fast-growing enterprise software stock that is already riding the automation wave and looking to catch the generative AI next.
Operating Margin
Operating margin is a key measure of profitability. Think of it as net income - the bottom line - excluding the impact of taxes and interest on debt, which are less connected to business fundamentals.
Northwest Pipe has done a decent job managing its cost base over the last five years. The company has produced an average operating margin of 8.8%, higher than the broader industrials sector.
Analyzing the trend in its profitability, Northwest Pipe’s operating margin rose by 3.8 percentage points over the last five years, as its sales growth gave it operating leverage.
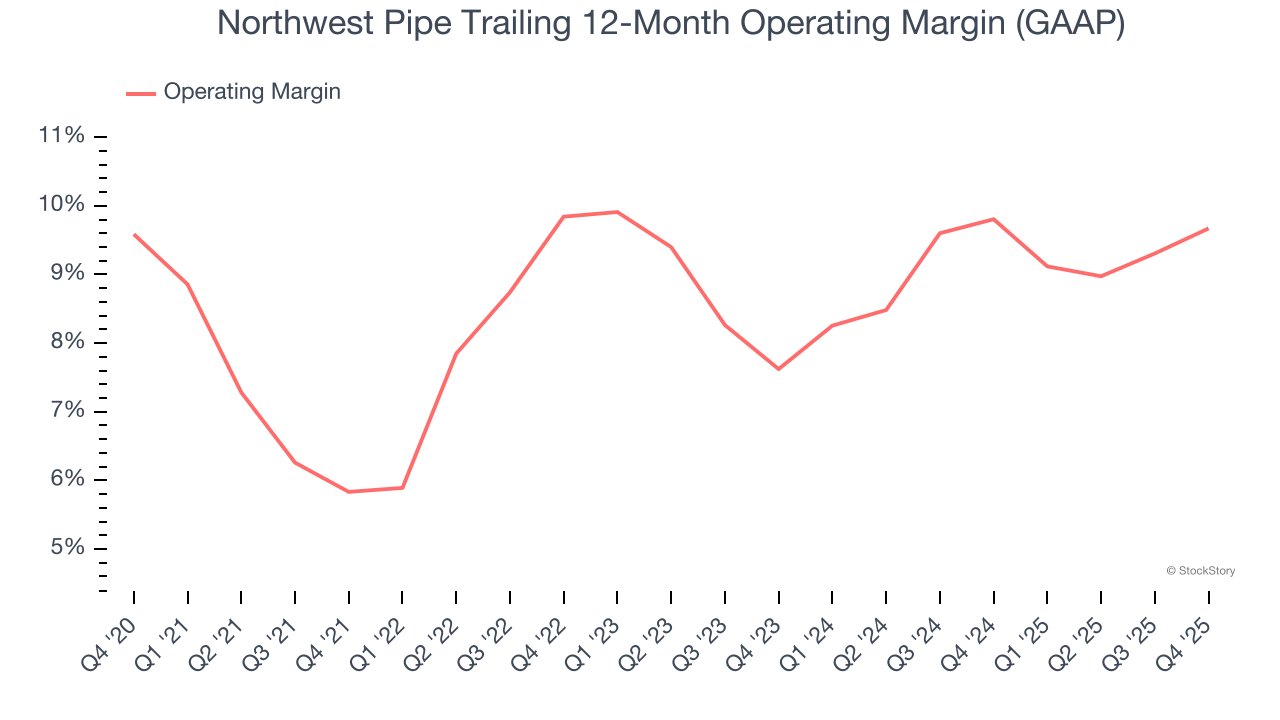
In Q4, Northwest Pipe generated an operating margin profit margin of 10.4%, up 1.6 percentage points year on year. Since its gross margin expanded more than its operating margin, we can infer that leverage on its cost of sales was the primary driver behind the recently higher efficiency.
Earnings Per Share
We track the long-term change in earnings per share (EPS) for the same reason as long-term revenue growth. Compared to revenue, however, EPS highlights whether a company’s growth is profitable.
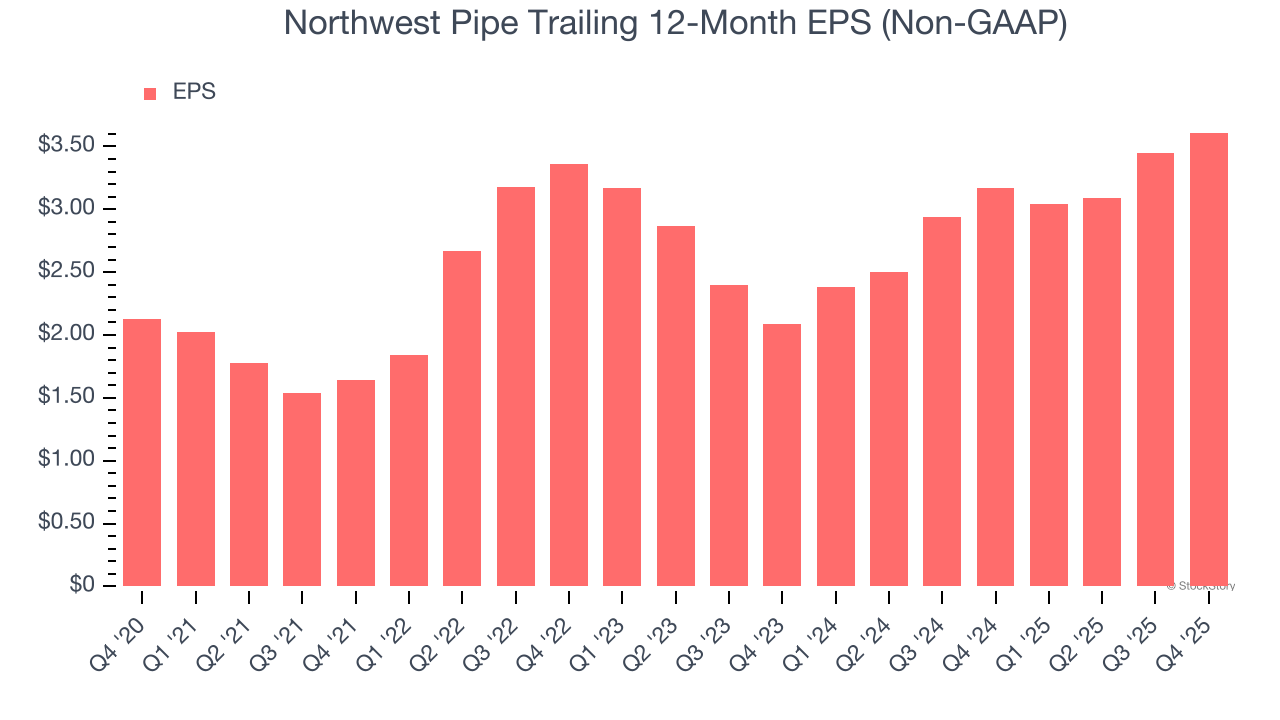
Northwest Pipe’s solid 11.1% annual EPS growth over the last five years aligns with its revenue performance. This tells us its incremental sales were profitable.
Like with revenue, we analyze EPS over a more recent period because it can provide insight into an emerging theme or development for the business.
Northwest Pipe’s two-year annual EPS growth of 31.4% was fantastic and topped its 8.8% two-year revenue growth.
We can take a deeper look into Northwest Pipe’s earnings to better understand the drivers of its performance. Northwest Pipe’s operating margin has expanded over the last two yearswhile its share count has shrunk 3%. These are positive signs for shareholders because improving profitability and share buybacks turbocharge EPS growth relative to revenue growth. 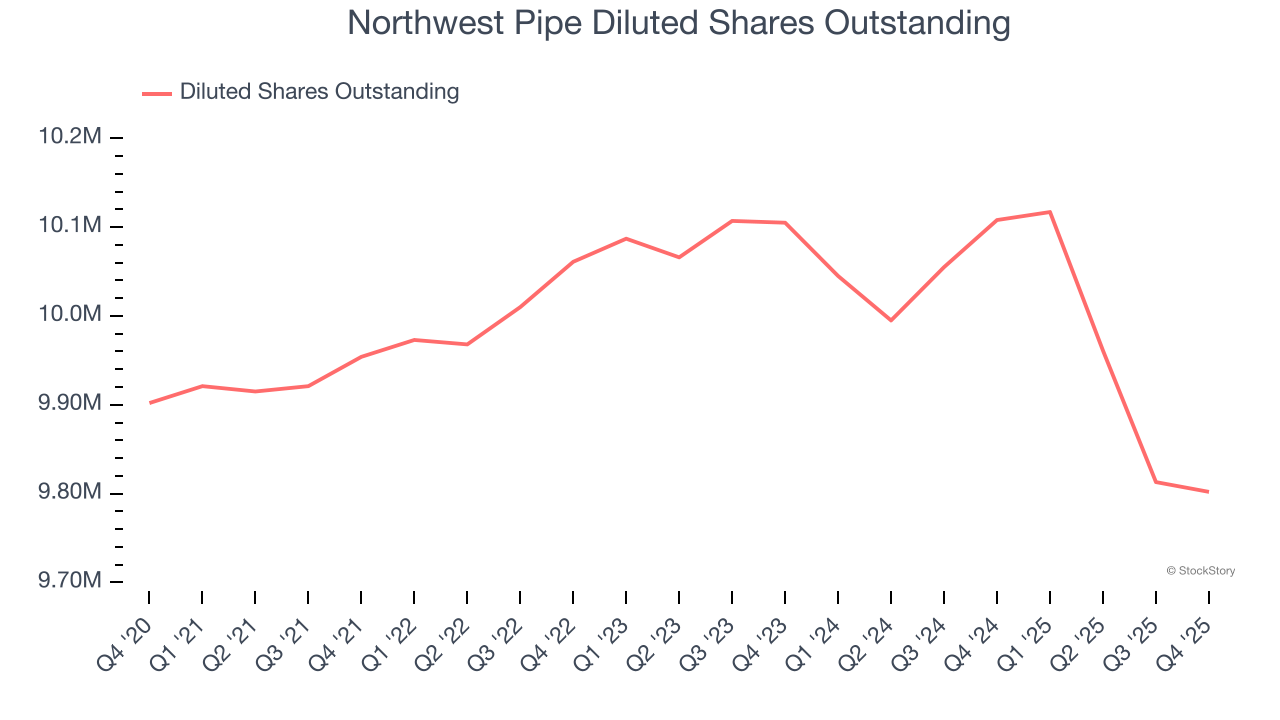
In Q4, Northwest Pipe reported adjusted EPS of $0.93, up from $0.77 in the same quarter last year. This print easily cleared analysts’ estimates, and shareholders should be content with the results. Over the next 12 months, Wall Street expects Northwest Pipe’s full-year EPS of $3.61 to grow 15%.
Key Takeaways from Northwest Pipe’s Q4 Results
It was good to see Northwest Pipe beat analysts’ EPS expectations this quarter. We were also glad its revenue outperformed Wall Street’s estimates. Zooming out, we think this was a solid print. The stock traded up 1% to $74.84 immediately after reporting.
Indeed, Northwest Pipe had a rock-solid quarterly earnings result, but is this stock a good investment here? What happened in the latest quarter matters, but not as much as longer-term business quality and valuation, when deciding whether to invest in this stock. We cover that in our actionable full research report which you can read here (it’s free).