
Packaging and materials company International Paper (NYSE: IP) beat Wall Street’s revenue expectations in Q4 CY2025, with sales up 31.1% year on year to $6.01 billion. Its non-GAAP loss of $0.08 per share was significantly below analysts’ consensus estimates.
Is now the time to buy International Paper? Find out by accessing our full research report, it’s free.
International Paper (IP) Q4 CY2025 Highlights:
- Revenue: $6.01 billion vs analyst estimates of $5.89 billion (31.1% year-on-year growth, 1.9% beat)
- Adjusted EPS: -$0.08 vs analyst estimates of $0.25 (significant miss)
- Adjusted EBITDA: -$1.96 billion vs analyst estimates of $778 million (-32.6% margin, significant miss)
- Operating Margin: -44.2%, down from -1.6% in the same quarter last year
- Free Cash Flow Margin: 4.2%, up from 3% in the same quarter last year
- Market Capitalization: $21.91 billion
"Throughout 2025, we made significant progress executing our profitable growth strategy," said Chairman and CEO Andy Silvernail.
Company Overview
Established in 1898, International Paper (NYSE: IP) produces containerboard, pulp, paper, and materials used in packaging and printing applications.
Revenue Growth
A company’s long-term performance is an indicator of its overall quality. Any business can put up a good quarter or two, but many enduring ones grow for years. Over the last five years, International Paper grew its sales at a sluggish 3.9% compounded annual growth rate. This was below our standard for the industrials sector and is a poor baseline for our analysis.
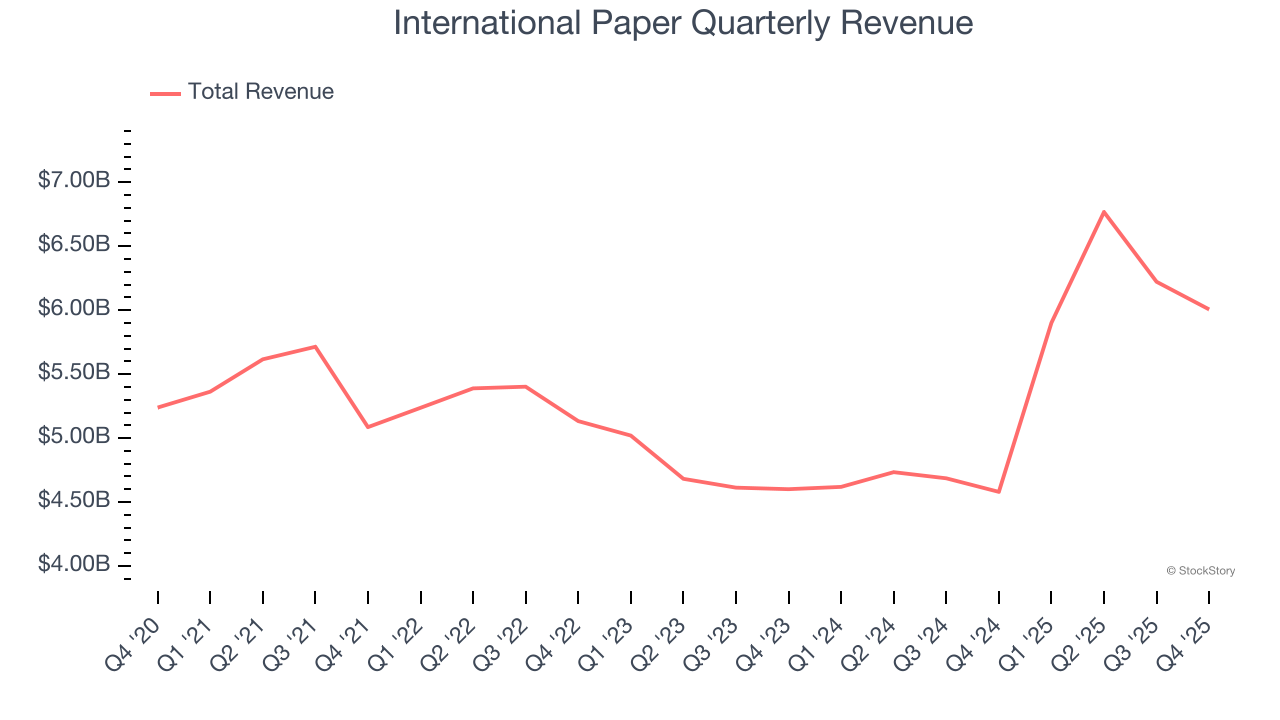
Long-term growth is the most important, but within industrials, a half-decade historical view may miss new industry trends or demand cycles. International Paper’s annualized revenue growth of 14.7% over the last two years is above its five-year trend, suggesting its demand recently accelerated. 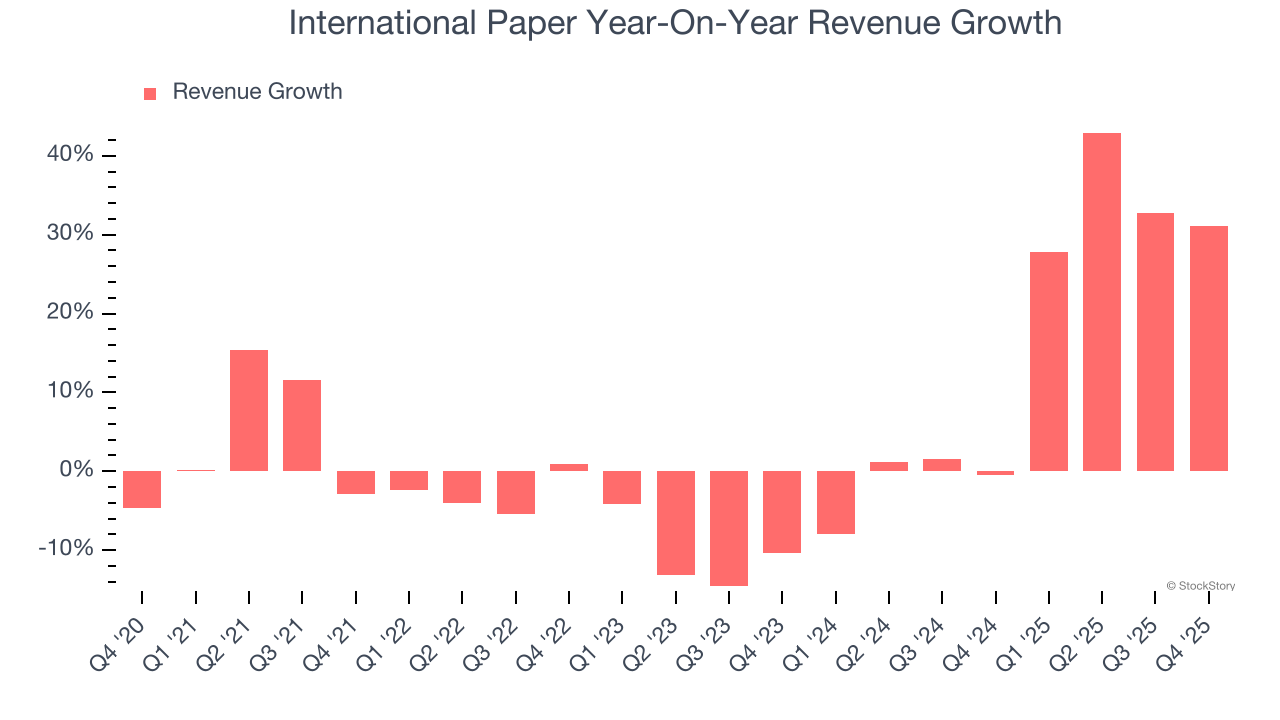
We can better understand the company’s revenue dynamics by analyzing its most important segment, Industrial Packaging. Over the last two years, International Paper’s Industrial Packaging revenue (containers, displays, bins) averaged 18.3% year-on-year growth. This segment has outperformed its total sales during the same period, lifting the company’s performance. 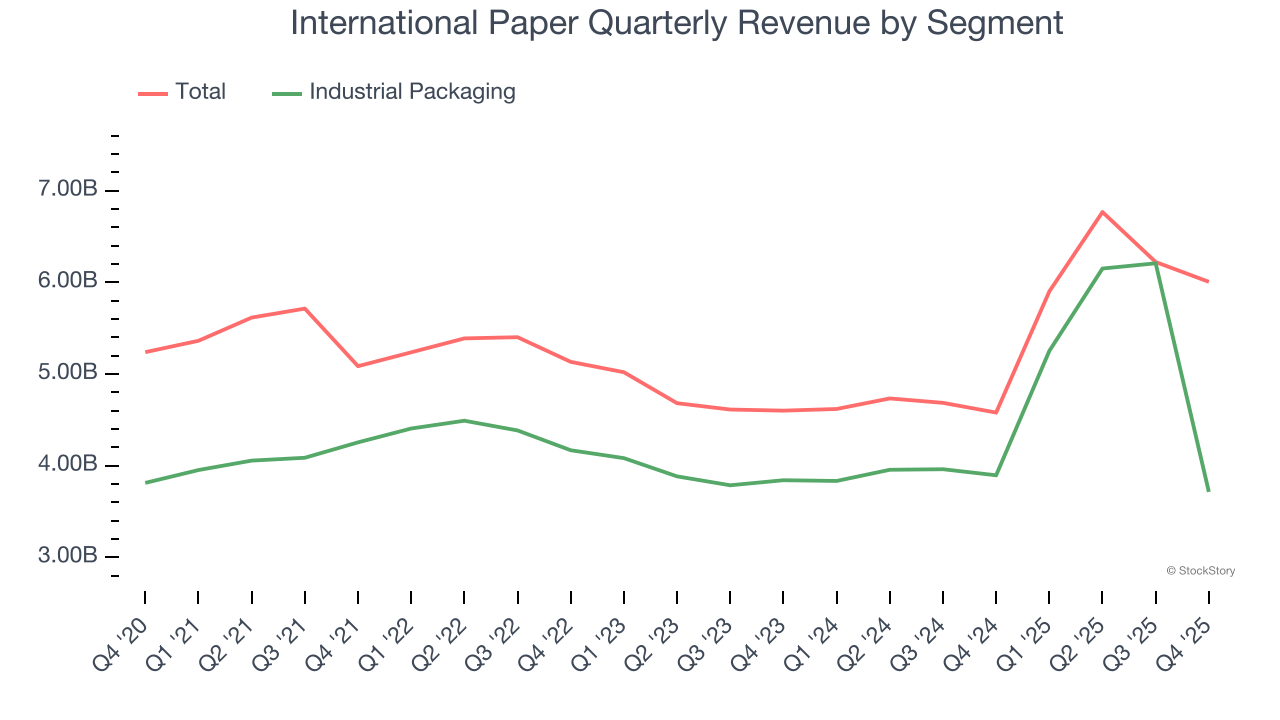
This quarter, International Paper reported wonderful year-on-year revenue growth of 31.1%, and its $6.01 billion of revenue exceeded Wall Street’s estimates by 1.9%.
Looking ahead, sell-side analysts expect revenue to decline by 1.4% over the next 12 months, a deceleration versus the last two years. This projection is underwhelming and indicates its products and services will face some demand challenges.
Microsoft, Alphabet, Coca-Cola, Monster Beverage—all began as under-the-radar growth stories riding a massive trend. We’ve identified the next one: a profitable AI semiconductor play Wall Street is still overlooking. Go here for access to our full report.
Operating Margin
Operating margin is a key measure of profitability. Think of it as net income - the bottom line - excluding the impact of taxes and interest on debt, which are less connected to business fundamentals.
International Paper was profitable over the last five years but held back by its large cost base. Its average operating margin of 2% was weak for an industrials business.
Analyzing the trend in its profitability, International Paper’s operating margin decreased by 19.1 percentage points over the last five years. This raises questions about the company’s expense base because its revenue growth should have given it leverage on its fixed costs, resulting in better economies of scale and profitability. International Paper’s performance was poor no matter how you look at it - it shows that costs were rising and it couldn’t pass them onto its customers.
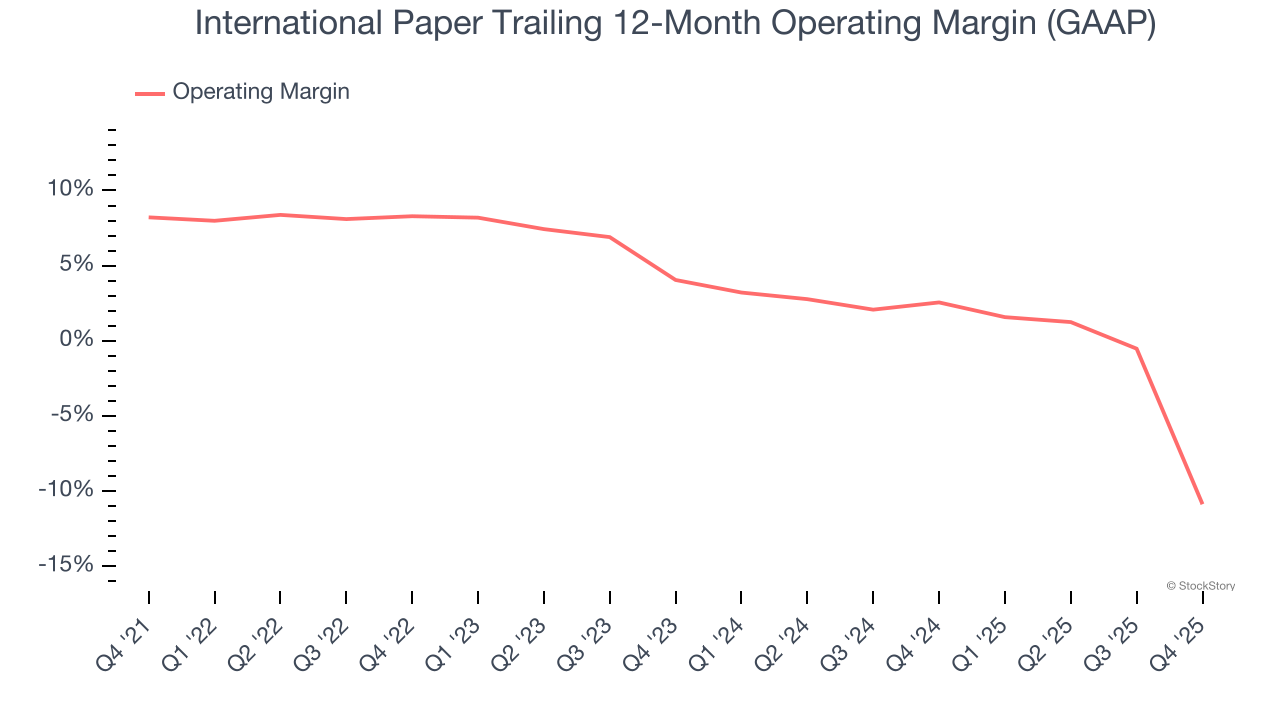
This quarter, International Paper generated an operating margin profit margin of negative 44.2%, down 42.6 percentage points year on year. Since International Paper’s operating margin decreased more than its gross margin, we can assume it was less efficient because expenses such as marketing, R&D, and administrative overhead increased.
Earnings Per Share
Revenue trends explain a company’s historical growth, but the long-term change in earnings per share (EPS) points to the profitability of that growth – for example, a company could inflate its sales through excessive spending on advertising and promotions.
Sadly for International Paper, its EPS declined by 15.2% annually over the last five years while its revenue grew by 3.9%. This tells us the company became less profitable on a per-share basis as it expanded.
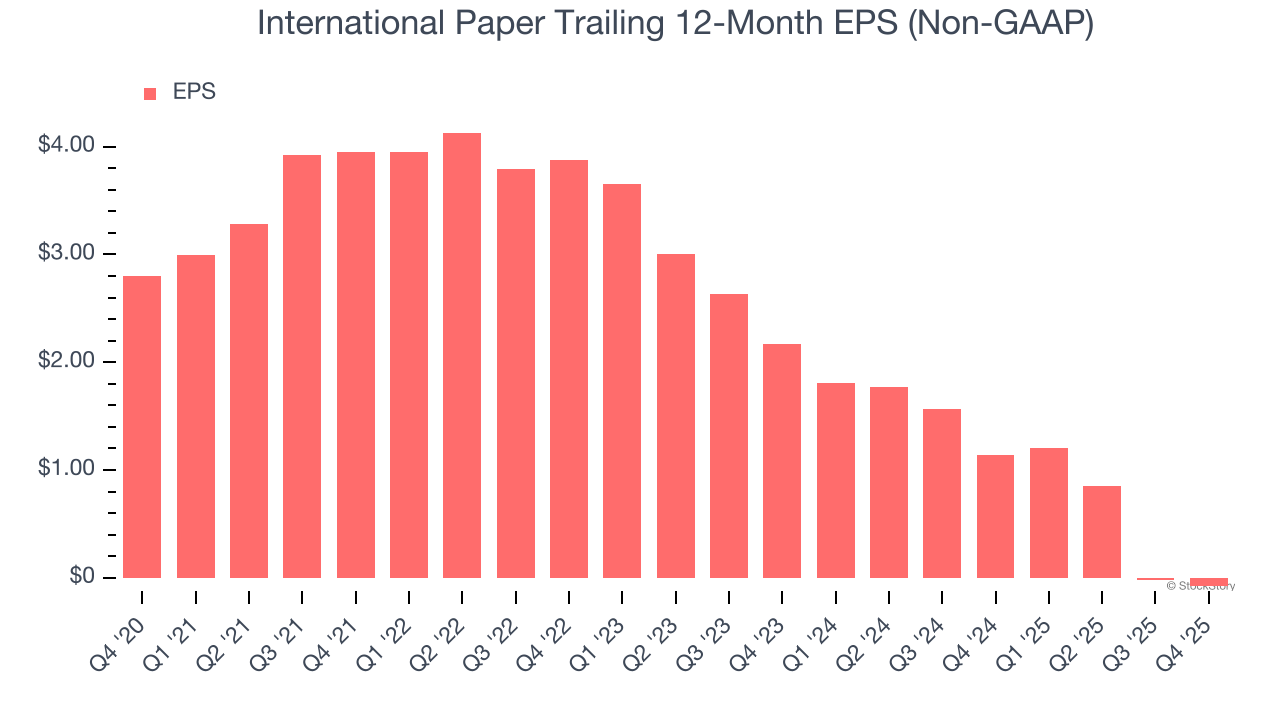
We can take a deeper look into International Paper’s earnings to better understand the drivers of its performance. As we mentioned earlier, International Paper’s operating margin declined by 19.1 percentage points over the last five years. Its share count also grew by 33.4%, meaning the company not only became less efficient with its operating expenses but also diluted its shareholders. 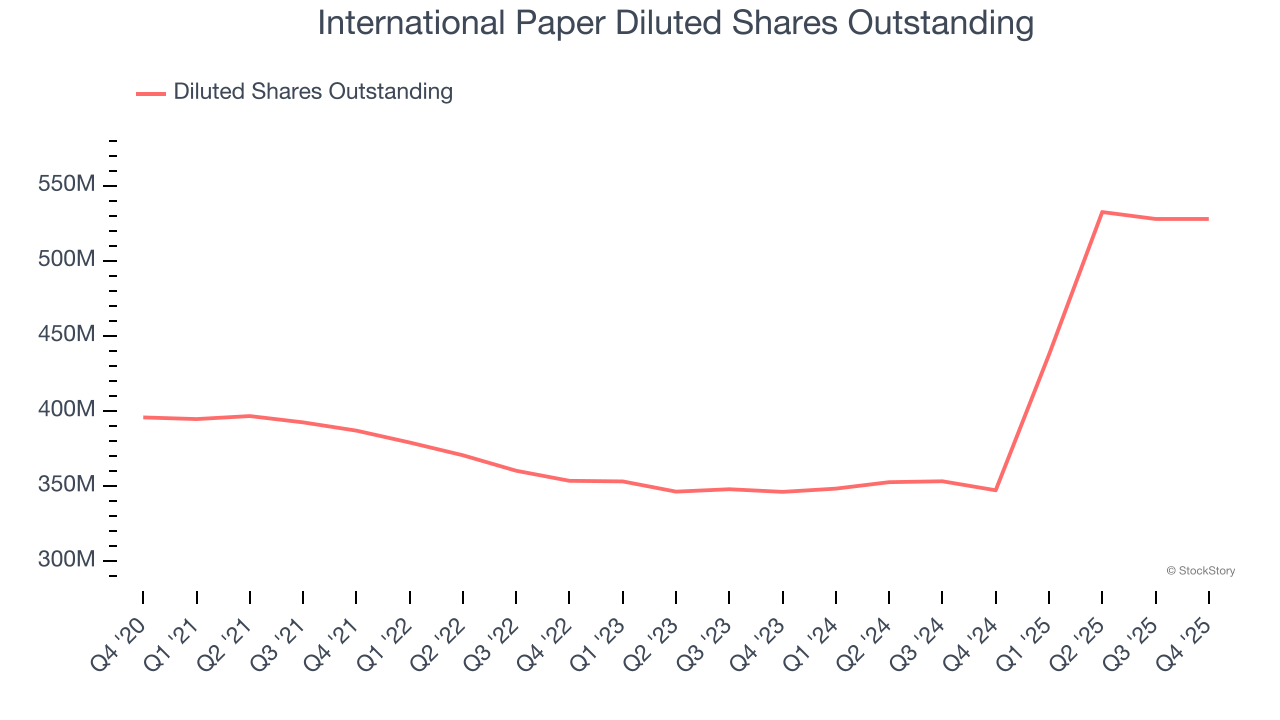
Like with revenue, we analyze EPS over a more recent period because it can provide insight into an emerging theme or development for the business.
For International Paper, its two-year annual EPS declines of 42.7% show it’s continued to underperform. These results were bad no matter how you slice the data.
In Q4, International Paper reported adjusted EPS of negative $0.08, down from negative $0.02 in the same quarter last year. This print missed analysts’ estimates. Over the next 12 months, Wall Street is optimistic. Analysts forecast International Paper’s full-year EPS of negative $0.08 will flip to positive $1.80.
Key Takeaways from International Paper’s Q4 Results
We enjoyed seeing International Paper beat analysts’ revenue expectations this quarter. On the other hand, its Industrial Packaging revenue missed and its EBITDA fell short of Wall Street’s estimates. Overall, this quarter could have been better. The stock traded up 2.1% to $42.38 immediately after reporting.
Should you buy the stock or not? We think that the latest quarter is only one piece of the longer-term business quality puzzle. Quality, when combined with valuation, can help determine if the stock is a buy. We cover that in our actionable full research report which you can read here (it’s free).


