
Engineered components manufacturer for critical industries ITT Inc. (NYSE: ITT) beat Wall Street’s revenue expectations in Q2 CY2025, with sales up 7.3% year on year to $972.4 million. Its non-GAAP profit of $1.64 per share was 1.8% above analysts’ consensus estimates.
Is now the time to buy ITT? Find out by accessing our full research report, it’s free.
ITT (ITT) Q2 CY2025 Highlights:
- Revenue: $972.4 million vs analyst estimates of $947.8 million (7.3% year-on-year growth, 2.6% beat)
- Adjusted EPS: $1.64 vs analyst estimates of $1.61 (1.8% beat)
- Adjusted EBITDA: $202 million vs analyst estimates of $208.6 million (20.8% margin, 3.2% miss)
- Management raised its full-year Adjusted EPS guidance to $6.45 at the midpoint, a 2.4% increase
- Operating Margin: 18%, in line with the same quarter last year
- Free Cash Flow Margin: 17.5%, up from 14.8% in the same quarter last year
- Organic Revenue rose 4.3% year on year (6% in the same quarter last year)
- Market Capitalization: $12.56 billion
Company Overview
Playing a crucial role in the development of the first transatlantic television transmission in 1956, ITT (NYSE: ITT) provides motion and fluid handling equipment for various industries
Revenue Growth
A company’s long-term sales performance can indicate its overall quality. Any business can put up a good quarter or two, but the best consistently grow over the long haul. Regrettably, ITT’s sales grew at a mediocre 7.2% compounded annual growth rate over the last five years. This wasn’t a great result compared to the rest of the industrials sector, but there are still things to like about ITT.
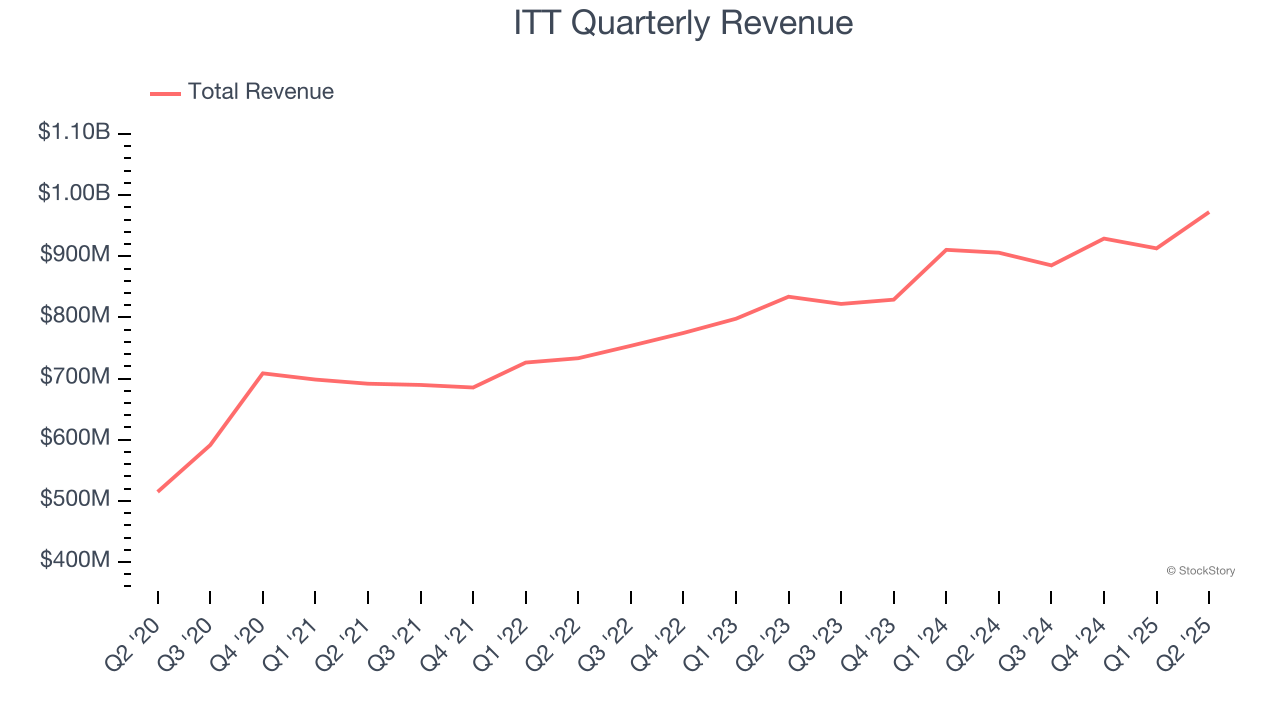
Long-term growth is the most important, but within industrials, a half-decade historical view may miss new industry trends or demand cycles. ITT’s annualized revenue growth of 8.2% over the last two years aligns with its five-year trend, suggesting its demand was stable. 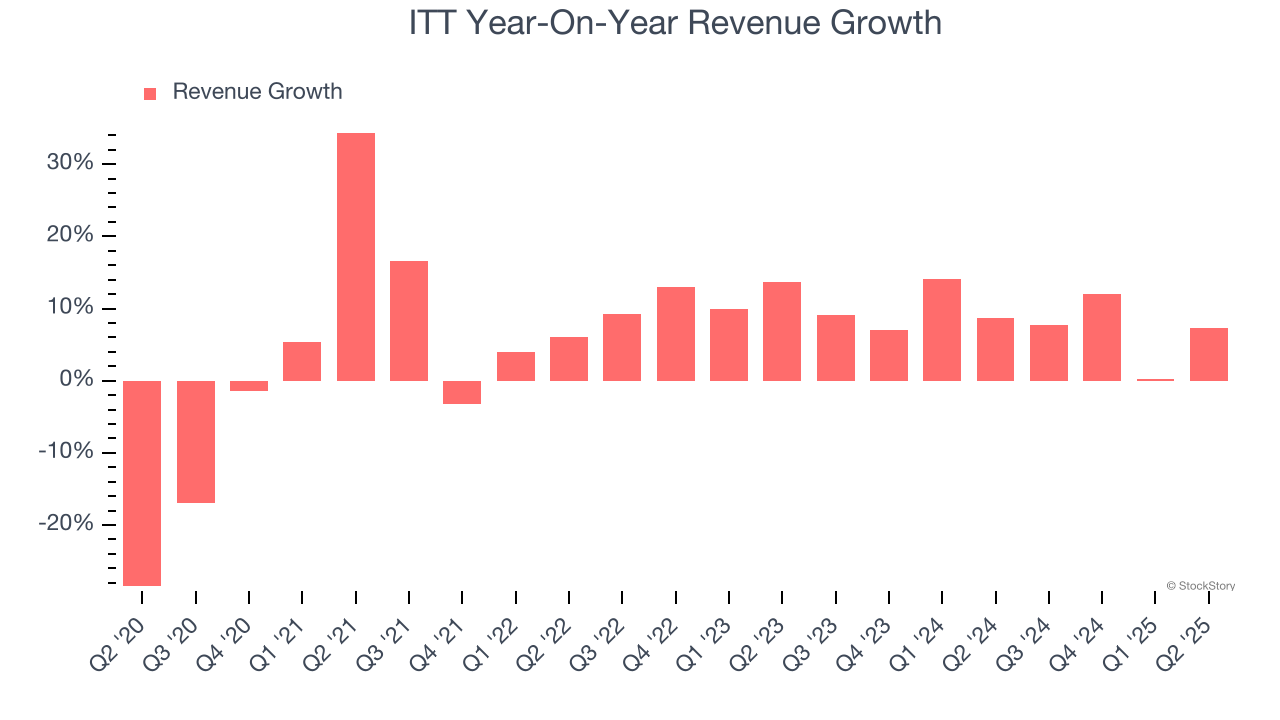
We can dig further into the company’s sales dynamics by analyzing its organic revenue, which strips out one-time events like acquisitions and currency fluctuations that don’t accurately reflect its fundamentals. Over the last two years, ITT’s organic revenue averaged 5.1% year-on-year growth. Because this number is lower than its two-year revenue growth, we can see that some mixture of acquisitions and foreign exchange rates boosted its headline results. 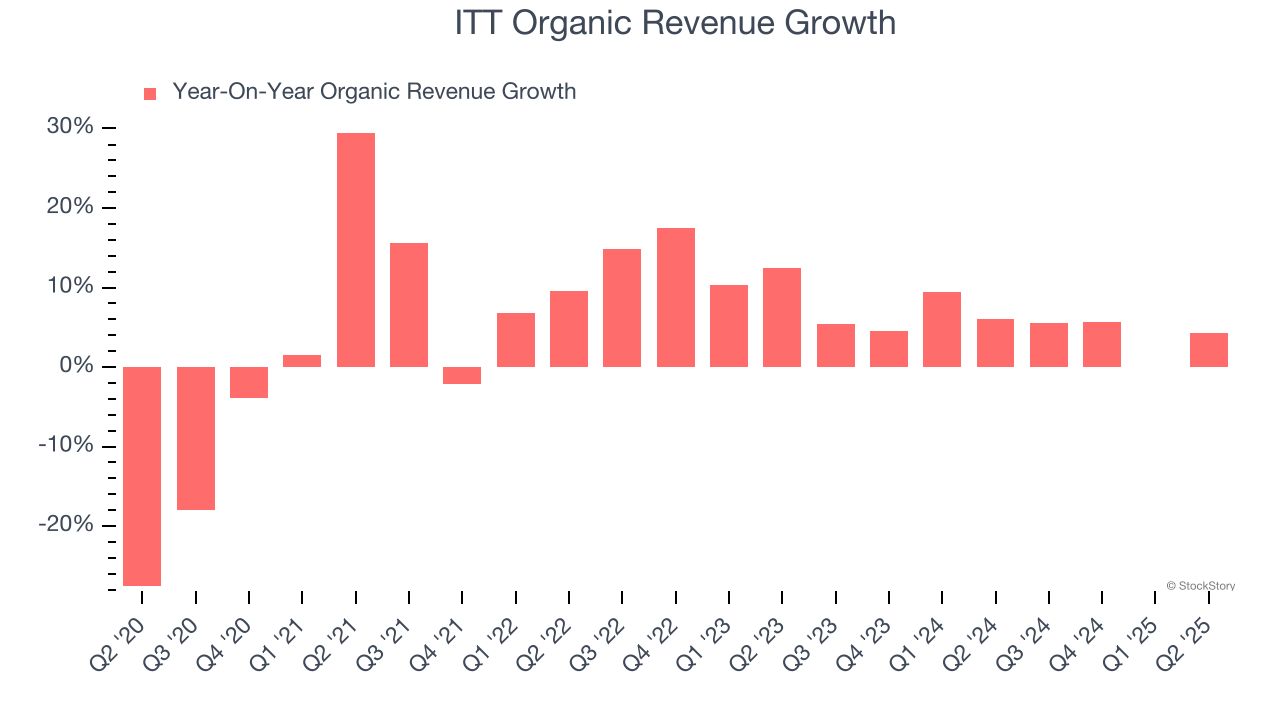
This quarter, ITT reported year-on-year revenue growth of 7.3%, and its $972.4 million of revenue exceeded Wall Street’s estimates by 2.6%.
Looking ahead, sell-side analysts expect revenue to grow 5.2% over the next 12 months, a deceleration versus the last two years. This projection doesn't excite us and implies its products and services will see some demand headwinds. At least the company is tracking well in other measures of financial health.
Unless you’ve been living under a rock, it should be obvious by now that generative AI is going to have a huge impact on how large corporations do business. While Nvidia and AMD are trading close to all-time highs, we prefer a lesser-known (but still profitable) stock benefiting from the rise of AI. Click here to access our free report one of our favorites growth stories.
Operating Margin
ITT has been a well-oiled machine over the last five years. It demonstrated elite profitability for an industrials business, boasting an average operating margin of 16.4%. This result isn’t too surprising as its gross margin gives it a favorable starting point.
Looking at the trend in its profitability, ITT’s operating margin rose by 4.4 percentage points over the last five years, as its sales growth gave it operating leverage.
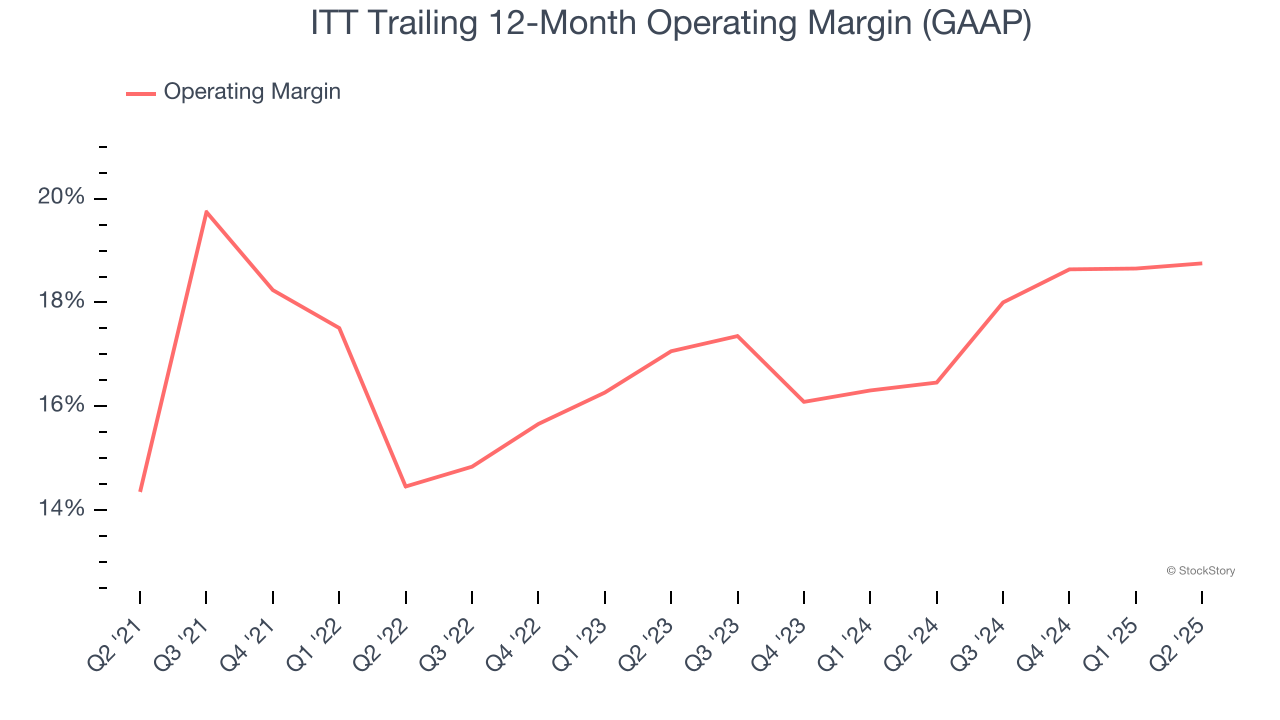
This quarter, ITT generated an operating margin profit margin of 18%, in line with the same quarter last year. This indicates the company’s cost structure has recently been stable.
Earnings Per Share
Revenue trends explain a company’s historical growth, but the long-term change in earnings per share (EPS) points to the profitability of that growth – for example, a company could inflate its sales through excessive spending on advertising and promotions.
ITT’s EPS grew at a remarkable 12.7% compounded annual growth rate over the last five years, higher than its 7.2% annualized revenue growth. This tells us the company became more profitable on a per-share basis as it expanded.
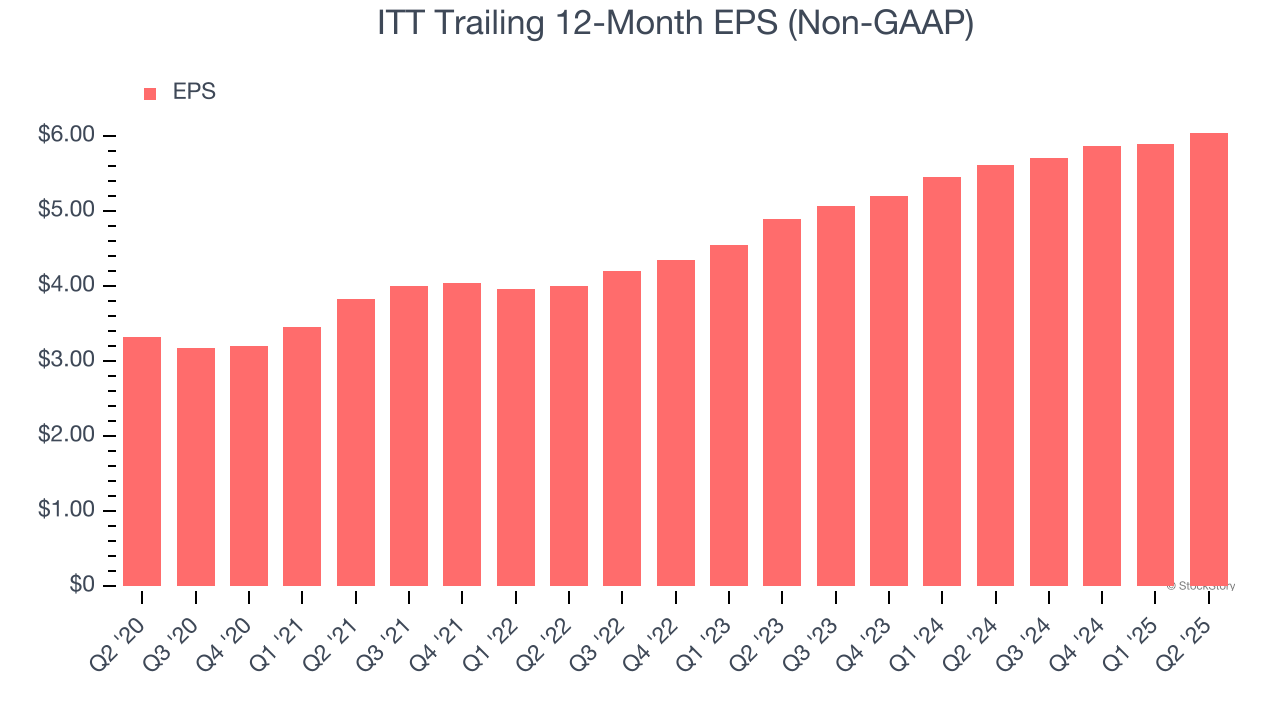
Diving into the nuances of ITT’s earnings can give us a better understanding of its performance. As we mentioned earlier, ITT’s operating margin was flat this quarter but expanded by 4.4 percentage points over the last five years. On top of that, its share count shrank by 8.5%. These are positive signs for shareholders because improving profitability and share buybacks turbocharge EPS growth relative to revenue growth. 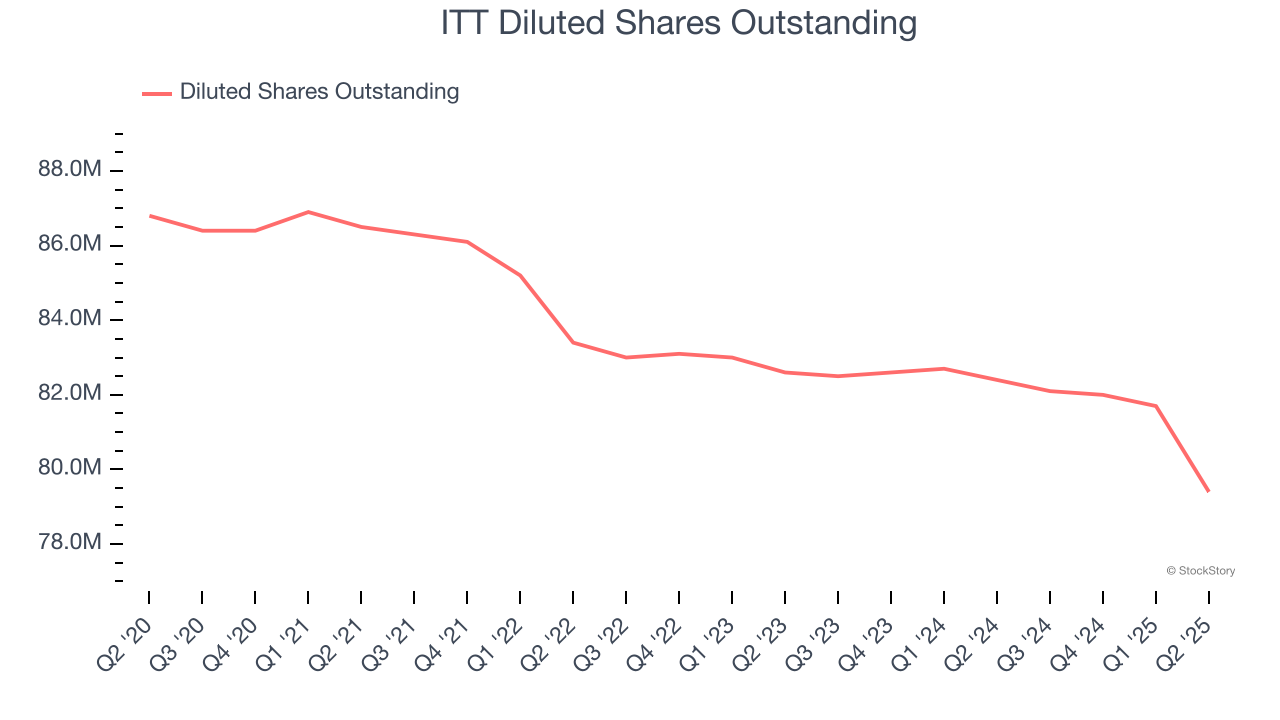
Like with revenue, we analyze EPS over a more recent period because it can provide insight into an emerging theme or development for the business.
For ITT, its two-year annual EPS growth of 11.1% was lower than its five-year trend. We still think its growth was good and hope it can accelerate in the future.
In Q2, ITT reported adjusted EPS at $1.64, up from $1.49 in the same quarter last year. This print beat analysts’ estimates by 1.8%. Over the next 12 months, Wall Street expects ITT’s full-year EPS of $6.05 to grow 12%.
Key Takeaways from ITT’s Q2 Results
We enjoyed seeing ITT beat analysts’ revenue expectations this quarter. We were also glad its organic revenue outperformed Wall Street’s estimates. On the other hand, its EBITDA missed. Overall, this print had some key positives. The stock remained flat at $160.54 immediately after reporting.
Indeed, ITT had a rock-solid quarterly earnings result, but is this stock a good investment here? If you’re making that decision, you should consider the bigger picture of valuation, business qualities, as well as the latest earnings. We cover that in our actionable full research report which you can read here, it’s free.


