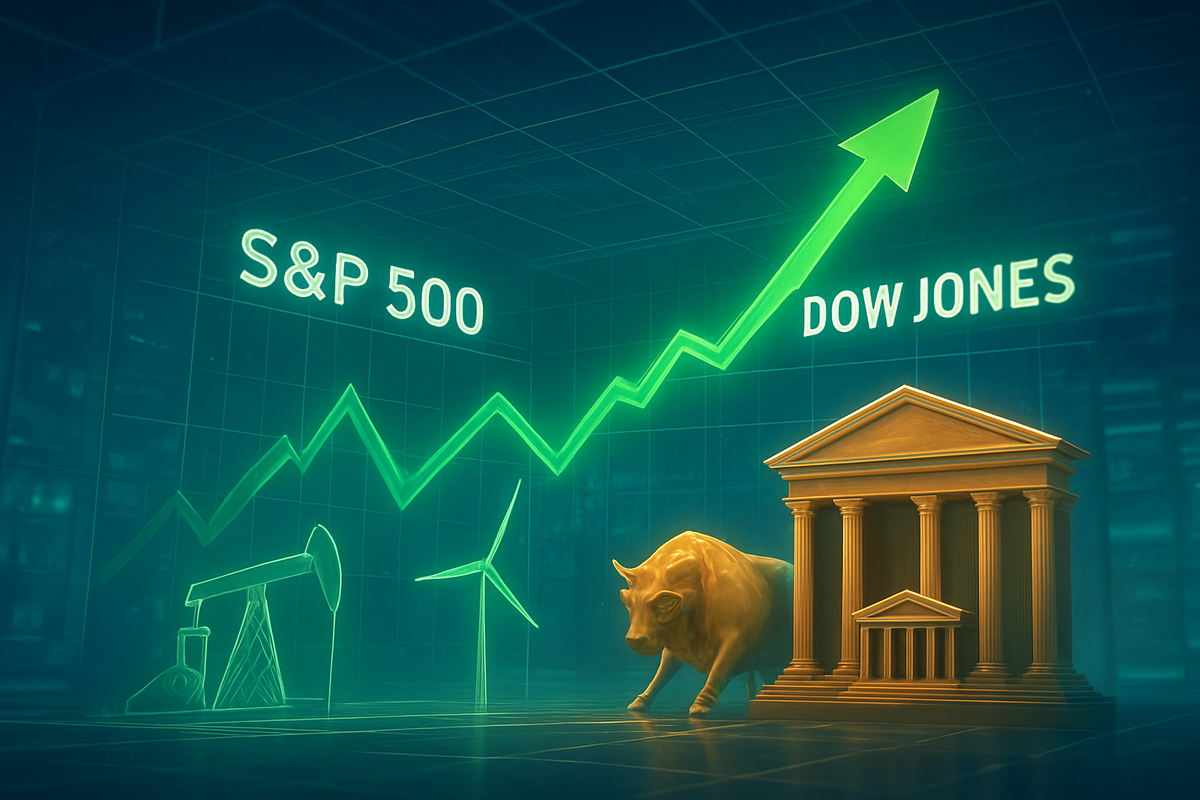
As the first full trading week of 2026 gets underway, the S&P 500 (NYSEARCA:SPY) is mounting a determined charge toward uncharted territory, following a trail blazed by the Dow Jones Industrial Average. On January 5, 2026, the S&P 500 climbed 0.7% to reach 6,894, hovering just a breath away from the psychological 6,900 barrier. This resurgence comes on the heels of the Dow’s own record-breaking performance, which saw the 30-stock index surge 639 points to hit a fresh all-time high of 48,858.
The immediate implication of this move is a definitive shift in market leadership. While the technology sector—the undisputed champion of the previous two years—has entered a period of consolidation, the "Physical Economy" is back in the driver's seat. Investors are aggressively rotating into cyclical sectors, particularly Energy and Financials, signaling a broadening of the market rally that many analysts believe is necessary for the next leg of the bull market.
A Technical Tug-of-War: Breaking the 6,900 Ceiling
The journey to these new highs was far from a straight line. The S&P 500 closed 2025 with a stellar 16.4% gain, but the final weeks of December were marred by a "Santa Claus No-Show." A rare four-session losing streak at the end of the year, driven by profit-taking in artificial intelligence stocks and concerns over the newly passed "OBBBA" trade legislation, left the index on a tenuous footing as the calendar turned. However, the first few days of January 2026 have seen a rapid reversal of that pessimism.
Technically, the S&P 500 is currently testing immediate resistance between 6,900 and 6,945. Market technicians are keeping a close eye on the 7,000 milestone, which represents the next major psychological hurdle. On the downside, the index has established a firm line of defense at the 50-day moving average of 6,805. A more significant "hard floor" is seen at 6,500, a level that has historically attracted strong buying interest during pullbacks.
The Dow Jones Industrial Average has shown even greater relative strength, largely due to its heavier weighting in value-oriented components. By clearing the 48,800 breakout zone, the Dow has turned former resistance into support, with the 200-day moving average at 48,081 serving as a long-term "buy" signal for institutional players. This divergence between the Dow and the tech-heavy Nasdaq suggests that the market's internal health is improving as more sectors participate in the gains.
The Engines of Growth: Banks and Big Oil
The primary catalysts for this early 2026 rally are the Financial and Energy sectors. Financial institutions are thriving in a "higher-for-longer" interest rate environment. JPMorgan Chase & Co. (NYSE: JPM) led the sector on January 5, hitting an intraday high of $337.25. The banking giant has been bolstered by expectations of a 17% dividend increase for the 2026 fiscal year and a dominant market position that allows it to maintain high net interest margins even as the Federal Reserve begins a "managed descent" of interest rates. Similarly, The Goldman Sachs Group, Inc. (NYSE: GS) has seen a resurgence in its investment banking division, fueled by a late-2025 wave of mergers and acquisitions and a more favorable regulatory climate.
In the Energy sector, a geopolitical "black swan" has provided an unexpected tailwind. The recent U.S. military intervention in Venezuela and the subsequent plans to stabilize and rebuild the country's oil infrastructure have sent ripples through the energy markets. Chevron Corp. (NYSE: CVX), the only U.S. major with a continuous presence in Venezuela, saw its shares surge 5% in the first week of the year. Investors view Chevron as the primary beneficiary of a potential supply-side revolution in the region.
Meanwhile, Exxon Mobil Corp. (NYSE: XOM) continues to trade near all-time highs, supported by record production levels in the Permian Basin. Analysts have recently raised price targets for Exxon to $137, citing the company’s disciplined capital allocation and its ability to remain profitable even if oil prices were to retreat. These companies are no longer just "value plays"; they are becoming the primary growth engines for the broader market as tech valuations undergo a necessary reset.
Broadening the Bull: Macro Shifts and Historical Precedents
This rotation into Energy and Financials fits into a broader industry trend of "re-globalization" and a focus on tangible assets. Throughout 2024 and 2025, the market was heavily concentrated in a few mega-cap tech names. The current shift suggests that the economy is resilient enough to support a wider range of industries. Historically, when the S&P 500 follows the Dow to new highs led by cyclicals, it often precedes a period of sustained, though perhaps less volatile, market growth.
The macroeconomic backdrop in January 2026 is one of cautious optimism. The Federal Reserve has maintained the Fed funds rate in the 3.50%–3.75% range. While inflation has cooled to 2.7%, it remains above the Fed's 2% target, leading to a divide among policymakers. Some "hawks" on the board are concerned that geopolitical tensions—such as the "Venezuela Shock"—could reignite inflationary pressures, while "doves" point to a creeping unemployment rate of 4.6% as a reason to continue cutting rates.
This "managed descent" by the Fed is a delicate balancing act. For the Financial sector, a slow reduction in rates is the "Goldilocks" scenario: it prevents a recession while allowing banks to keep lending profitable. For the Energy sector, the geopolitical instability acts as a double-edged sword, providing a floor for prices while complicating long-term supply chain logistics.
The Road to 7,000: What Lies Ahead
In the short term, all eyes are on the upcoming Q4 2025 earnings season. Investors will be looking for confirmation that the robust performance of the Energy and Financial sectors is backed by hard data. If JPMorgan and ExxonMobil can deliver on their optimistic guidance, the S&P 500 could easily clear the 7,000 mark before the end of the first quarter. However, any signs of a sharper-than-expected slowdown in consumer spending could quickly put the 6,805 support level to the test.
Strategically, the market may see a "pivot back to basics." Companies that have over-invested in speculative AI projects without clear paths to monetization may face further de-ratings, while those with strong cash flows and high dividend yields will likely remain in favor. The potential for a "soft landing" remains the base case, but the path is narrow.
The biggest challenge for the market in 2026 will be navigating the trade-offs of the new legislative environment. The "OBBBA" trade act and various deregulation incentives have created winners and losers overnight. Investors will need to be more selective than ever, moving away from "index-hugging" strategies and toward active sector rotation.
A New Market Paradigm
The S&P 500’s climb toward 6,900 is more than just a numerical milestone; it is a sign of a maturing bull market. By following the Dow Jones to new highs, the broader index is demonstrating that the rally has moved beyond the "Magnificent Seven" and into the bedrock of the American economy. The dominance of Financials and Energy in this leg of the journey suggests that investors are pricing in a period of sustained, if moderate, economic growth.
Moving forward, the market’s health will depend on whether this "Great Rotation" can maintain its momentum. Investors should watch for the S&P 500 to consolidate above 6,900, which would set the stage for a run at 7,000. Key indicators to monitor include the Fed's "dot plot" updates in March and any further geopolitical developments in South America that could impact global energy supplies.
Ultimately, the early days of 2026 have proven that the market is capable of reinventing itself. While the tech-driven frenzy of the past may be cooling, the rise of the cyclicals offers a new, and perhaps more stable, foundation for investors to build upon in the months to come.
This content is intended for informational purposes only and is not financial advice.


