Food and Grocery Costs Expected to Rise According to 86% of Respondents
Inflation continues to be the top concern of middle-income Americans, according to Primerica’s latest Financial Security Monitor™ (FSM™), with 62% reporting stress over finances, up from 57% during the fourth quarter of 2024. Forty-six percent (46%) expect to be worse off financially in the next year, up from 27% in December 2024.
This press release features multimedia. View the full release here: https://www.businesswire.com/news/home/20250409910736/en/
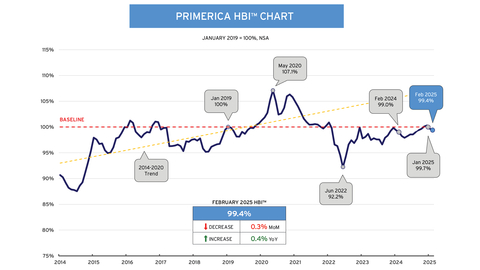
The latest Primerica Household Budget Index™ (HBI™), which measures the purchasing power of middle-income families, found that middle-income families’ perceptions of their personal finances align with overall economic conditions. Eighty-six percent (86%) of FSM™ respondents expect the costs of food and groceries to rise alongside utilities (77%) and fuel (76%) in the coming months. This trend is also highlighted in the HBI™, which shows average purchasing power for necessities dropped 0.3% in February compared to January as middle-income families paid more for less. Rising costs of car insurance, gasoline and utilities served as the main drivers for the decrease.
“Middle-income Americans continue to face significant financial stress, and they are not anticipating relief in the near future,” said Glenn J. Williams, CEO of Primerica. “This makes having a clear financial game plan even more essential to helping families navigate whatever the future brings. Prioritization is key — understanding where to focus, what to adjust and how to stay on track amid economic uncertainty.”
The latest Primerica Household Budget Index™ (HBI™), which measures the purchasing power of middle-income families, found that middle-income families’ perceptions of their personal finances align with overall economic conditions. Eighty-six percent (86%) of FSM™ respondents expect the costs of food and groceries to rise alongside utilities (77%) and fuel (76%) in the coming months. This trend is also highlighted in the HBI™, which shows average purchasing power for necessities dropped 0.3% in February compared to January as middle-income families paid more for less. Rising costs of car insurance, gasoline and utilities served as the main drivers for the decrease.
“Middle-income Americans are navigating a financial landscape that feels increasingly unpredictable, with rising costs stretching household budgets and disproportionately impacting middle-income families, accounting for over 55% of the U.S. population,” said Amy Crews Cutts, Ph.D., CBE®, economic consultant to Primerica. “Cost increases are weighing heavily on households, signaling deep unease about the road ahead.”
Additional key findings from Primerica’s Q1 2025 U.S. Middle-Income Financial Security Monitor™ (FSM™)
- Middle-income Americans are increasingly concerned about their financial future. Nearly half (46%) of respondents expect their financial situation to worsen in the coming year, up from 27% in Q4 2024. Only 18% believe their situation will improve in the next year, compared with 26% of respondents in the previous survey.
- Families are cutting back on spending. Reaching the highest level in two years, 78% report limiting non-essential purchases, such as eating out and entertainment. In addition, 64% say they are setting aside money for an emergency fund, up from 59% in the previous survey.
- Changing jobs or even adding a second one is top of mind to close the gap between incomes and expenses. Fifty-two percent (52%) report either considering getting or already having a second job. More than half (55%) are considering changing or are already actively switching jobs.
- Majority expect a 2024 tax refund. Fifty-three percent (53%) anticipate getting money back on their returns this year, with the top plans for those refunds including: saving (38%), paying down debt (32%) and/or paying outstanding bills (30%).
Primerica Financial Security Monitor™ (FSM™) Topline Trends Data
Mar 2025 |
Dec
|
Sept
|
Jun 2024 |
Mar 2024 |
Dec 2023 |
Sept 2023 |
Jun 2023 |
Mar 2023 |
|
How would you rate the condition of your personal finances? |
|||||||||
Share reporting “Excellent” or “Good.” |
48% |
45% |
44% |
49% |
50% |
50% |
49% |
50% |
52% |
Analysis: Respondents’ assessments of their personal finances are down slightly from where they were a year ago. |
|||||||||
Overall, would you say your income is…? |
|||||||||
Share reporting “Falling behind the cost of living” |
69% |
65% |
68% |
66% |
67% |
68% |
72% |
71% |
72% |
Share reporting “Stayed about even with the cost of living” |
23% |
29% |
24% |
26% |
25% |
24% |
20% |
22% |
21% |
Analysis: Concern about meeting the increased cost of living remained steady with 92% noting an inability to get ahead. |
|||||||||
And in the next year, do you think the American economy will be…? |
|||||||||
Share reporting “Worse off than it is now” |
76% |
55% |
25% |
40% |
46% |
53% |
56% |
57% |
53% |
Share reporting “Uncertain” |
4% |
9% |
34% |
19% |
18% |
9% |
9% |
9% |
7% |
Analysis: The share of respondents expecting the economy to worsen over the next year has risen sharply since the previous poll. |
|||||||||
Do you have an emergency fund that would cover an expense of $1,000 or more (for example, if your car broke down or you had a large medical bill)? |
|||||||||
Reporting “Yes” responses |
64% |
59% |
61% |
63% |
62% |
60% |
62% |
61% |
58% |
Analysis: The percentage of Americans who have an emergency fund that would cover an expense of $1,000 or more has climbed since the previous survey. |
|||||||||
How would you rate the economic health of your community? |
|||||||||
Reporting “Not so good” and “Poor” responses |
66% |
63% |
63% |
58% |
60% |
57% |
55% |
54% |
59% |
Analysis: Respondents’ rating of the economic health of their communities has gotten worse over the past year. |
|||||||||
How would you rate your ability to save for the future? |
|||||||||
Reporting “Not so good” and “Poor” responses |
71% |
71% |
73% |
68% |
67% |
73% |
71% |
71% |
73% |
Analysis: A significant majority continue to feel it is difficult to save for the future. |
|||||||||
In the past three months, has your credit card debt…? |
|||||||||
Reporting “Increased” responses |
31% |
34% |
35% |
30% |
34% |
35% |
34% |
33% |
33% |
Analysis: Credit card debt has remained about the same over the past year. |
|||||||||
About Primerica’s Middle-Income Financial Security Monitor™ (FSM™)
Since September 2020, the Primerica Financial Security Monitor™ has surveyed middle-income households quarterly to gain a clear picture of their financial situation, and it coincides with the release of the monthly HBI™ four times annually. Polling was conducted online from March 3-6, 2025. Using Dynamic Online Sampling, Change Research polled 1,240 adults nationwide with incomes between $30,000 and $130,000. Post-stratification weights were made on gender, age, race, education and Census region to reflect the population of these adults based on the five-year averages in the 2021 American Community Survey, published by the U.S. Census. The margin of error is 3.1%. For more information visit Primerica.com/public/financial-security-monitor.html.
About the Primerica Household Budget Index™ (HBI™)
The Primerica Household Budget Index™ (HBI™) is constructed monthly on behalf of Primerica by its chief economic consultant Amy Crews Cutts, PhD, CBE®. The index measures the purchasing power of middle-income families with household incomes from $30,000 to $130,000 and is developed using data from the U.S. Bureau of Labor Statistics, the U.S. Bureau of the Census, and the Federal Reserve Bank of Kansas City. The index looks at the cost of necessities including food, gas, auto insurance, utilities, and health care and earned income to track differences in inflation and wage growth.
The HBI™ uses January 2019 as its baseline, with the value set to 100% at that point in time.
Periodically, prior HBI™ values may be modified due to revisions in the CPI series and Consumer Expenditure Survey releases by the U.S. Bureau of Labor Statistics (BLS). Beginning with the December 2024 release of the index, the expenditure weights have been updated to the most recent (Q1 2024) data and auto insurance has been added to the group of necessity items. For more information, visit householdbudgetindex.com.
About Primerica, Inc.
Primerica, Inc., headquartered in Duluth, GA, is a leading provider of financial products and services to middle-income households in North America. Independent licensed representatives educate Primerica clients about how to better prepare for a more secure financial future by assessing their needs and providing appropriate solutions through term life insurance, which we underwrite, and mutual funds, annuities and other financial products, which we distribute primarily on behalf of third parties. We insured over 5.5 million lives and had approximately 3.0 million client investment accounts on December 31, 2024. Primerica, through its insurance company subsidiaries, was the #3 issuer of Term Life insurance coverage in the United States and Canada in 2024. Primerica stock is included in the S&P MidCap 400 and the Russell 1000 stock indices and is traded on The New York Stock Exchange under the symbol “PRI”. For more information, visit www.primerica.com.
View source version on businesswire.com: https://www.businesswire.com/news/home/20250409910736/en/
Contacts
Media Contact:
Gana Ahn
678-431-9266
Email: Gana.Ahn@primerica.com
Investor Contact:
Nicole Russell
470-564-6663
Email: Nicole.Russell@primerica.com


