Adobe (ADBE) hasn’t exactly impressed investors with its performance in the new year, with ADBE stock dubiously earning the label of 100% Strong Sell by the Barchart Technical Opinion indicator. Such ignominy isn’t terribly surprising, with the security losing over 26% of value on a year-to-date basis. Over the past 52 weeks, it’s down nearly 42%.
Adding to the pressure, a recent read from the options flow screener will likely not soothe frayed nerves. A representation focused purely on big block transactions, options flow during the Feb. 19 session saw net trade sentiment stumble to more than $223 million below parity. A session before that, this metric fell to about $32 million below parity.
But before you start panicking out of ADBE stock, there’s an important nuance to keep in mind. Throughout this month, the biggest transactions featuring negative sentiment primarily featured put options that expired last Friday. While the surface area being littered with debit-based puts wasn’t exactly encouraging, what is heartening is that this sentiment headwind has effectively cleared.
Even better, volatility skew suggests that, moving forward, the main prioritization isn’t necessarily downside protection. Of course, when you’re dealing with a major name like ADBE stock, risk management is key. Adobe is popular with both retail traders and the institutional types. In essence, the skew provides a holistic picture of how the smart money is positioned.
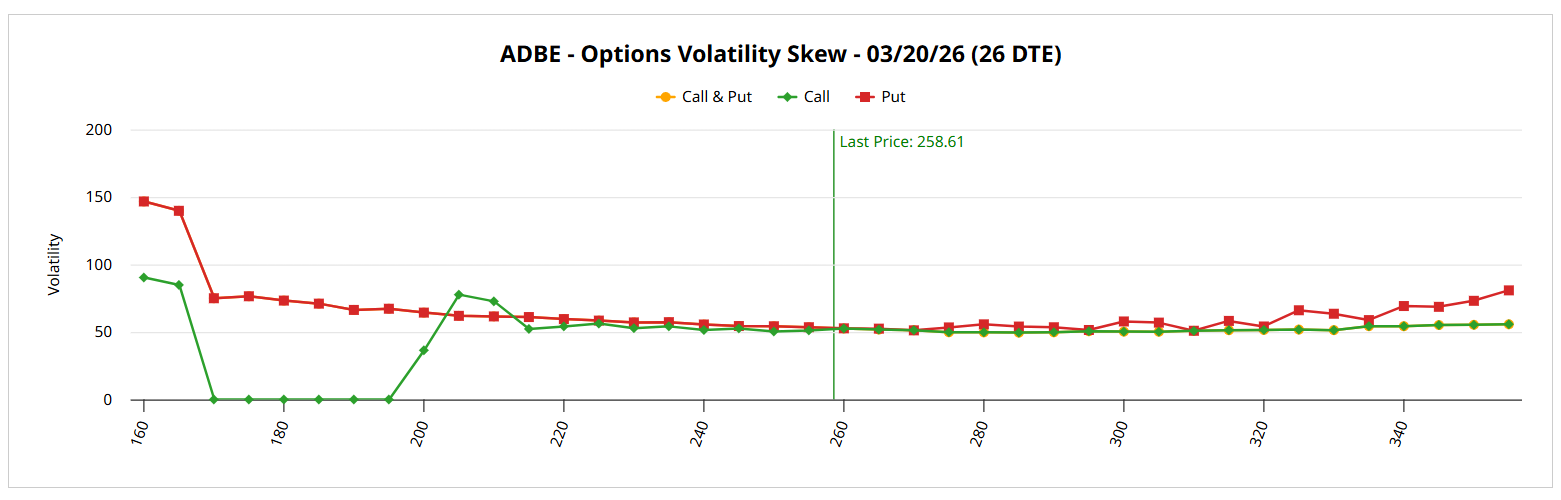
What we’re looking for are aberrant spikes in implied volatility (IV), which would effectively suggest heightened demand for exposure-based insurance. However, the skew is relatively calm, meaning that while there is insurance being bought to protect against sharp downside exposure (commonly referred to as tail risk), the urgency simply isn’t there.
Basically, we have information by omission. After such a sharp drop in ADBE stock, you would expect the smart money to cover the flanks. It’s refusing to do so with any meaningful vigor, which may imply a possible recovery.
Establishing the Trading Parameters of ADBE Stock
While we now have a working understanding of smart money positioning, we still need to figure out how this may translate into actual price outcomes. For that, we may turn to the Black-Scholes-derived Expected Move calculator. Wall Street’s standard mechanism for pricing options projects that Adobe stock will land somewhere between $233.42 and $283.80 by the March 20 expiration date.
Where does this dispersion come from? In the simplest of terms, Black-Scholes represents a mathematical model, projecting a symmetrical price envelope from the spot price. These aren’t just randomly generated numbers but are derived from IV, which itself is a residual metric derived from actual order flows.
Further, the dispersion follows an elegant logic, which amounts to one standard deviation from spot, while also accounting for volatility and days to expiration. Essentially, Black-Scholes follows a principle that in 68% of cases (34% on the positive tail, 34% on the negative tail), we would expect Adobe stock to fall within the dispersion.
For the unusual cases (32% of the time or 16% on each tail), ADBE may fall outside the expected move dispersion. Our job as analysts, then, is to attempt to narrow the range of possibilities as much as possible.
That’s why I keep harping on the search-and-rescue (SAR) conundrum because it does a lot of conceptual heavy lifting. If ADBE stock is a lone shipwrecked survivor, Black-Scholes would be a satellite system that detected a distress signal somewhere in the Pacific Ocean. The aforementioned calculator is a theoretical tool that establishes the search radius for our survivor.
However, we live in a world of limited resources, which means that sometimes, we can’t cover the entire area. We need an additional insight to help us maximize our personnel and equipment amid our constrained circumstances.
One tool that’s especially useful for a security with a long history like Adobe stock is Seasonal Returns.
Helping to Narrow the Probability Space
Seasonal Returns is essentially a statistical heatmap that shows the month-to-month tendencies of a selected equity candidate. What I appreciate about this screener is that it provides context and color (literally). As useful as Black-Scholes may be as an initial reference point, the underlying formula treats volatility as an independent input.
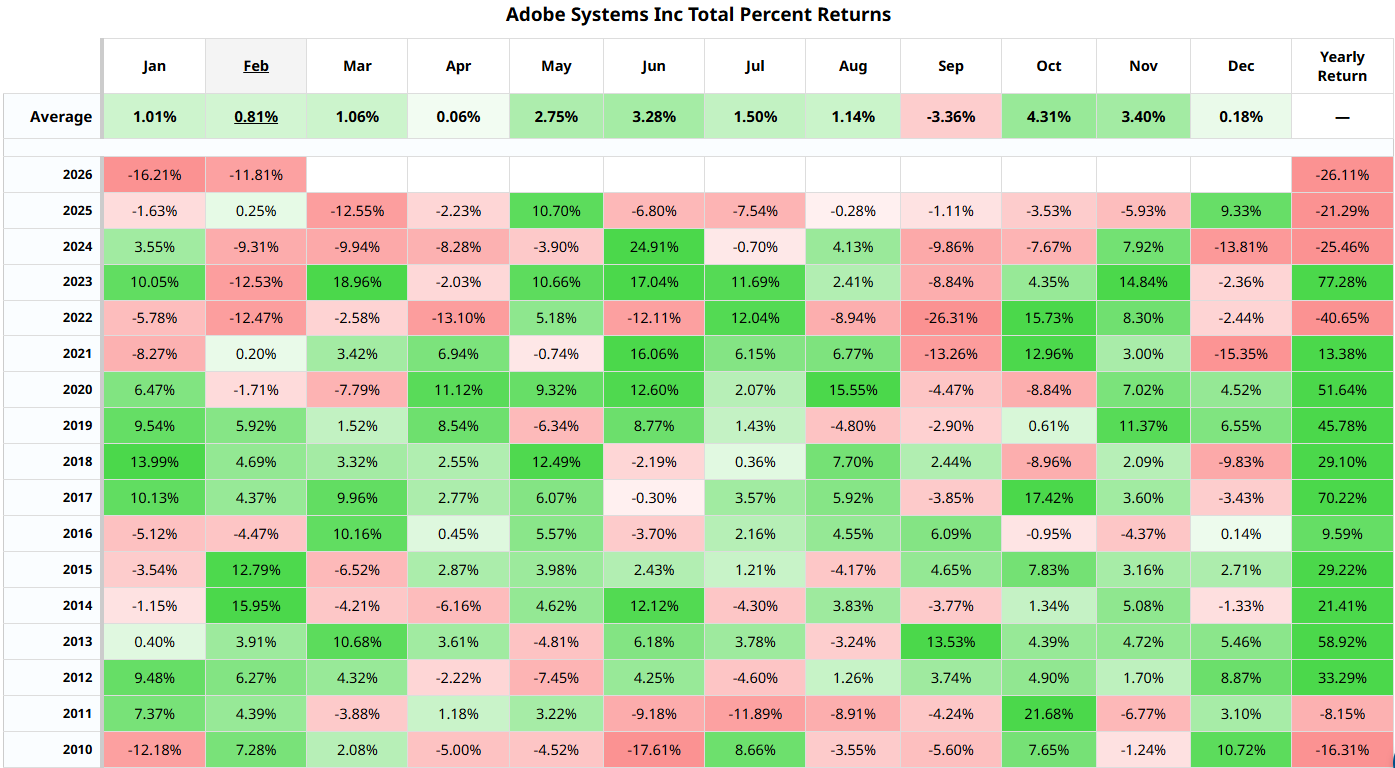
With Seasonal Returns, we can observe how different months tend to provide a different contextual backdrop, which may influence forward probabilities. For example, in the case of ADBE stock, February is known for having three instances of double-digit losses: 2022, 2023 and 2026 (so far). In March, this dubious statistic is whittled down to one.
I’m going to speculate that, in combination with the relatively relaxed volatility skew and the bearish options flow expiring shortly, the March monthly options chain may provide a bullish opportunity. Specifically, I’m tempted by the 265/280 bull call spread expiring March 20.
With a $270.95 breakeven price, you’re looking at a 4.77% gap to breakeven, which is reasonable when looking at March’s average positive-month performances.
On the date of publication, Josh Enomoto did not have (either directly or indirectly) positions in any of the securities mentioned in this article. All information and data in this article is solely for informational purposes. For more information please view the Barchart Disclosure Policy here.
More news from Barchart
- Adobe (ADBE) Stock Has Been Beaten Up But the Smart Money Remains Resilient
- If Palantir is Near a Bottom, What's the Best Play in PLTR Stock?
- The Saturday Spread: Using Volatility Skew as a Smart Money Gauge (TGT, AAPL, ORCL)
- Unusual Options Activity Alert: If You Own These 3 Stocks, It’s Time for a Protective Collar


